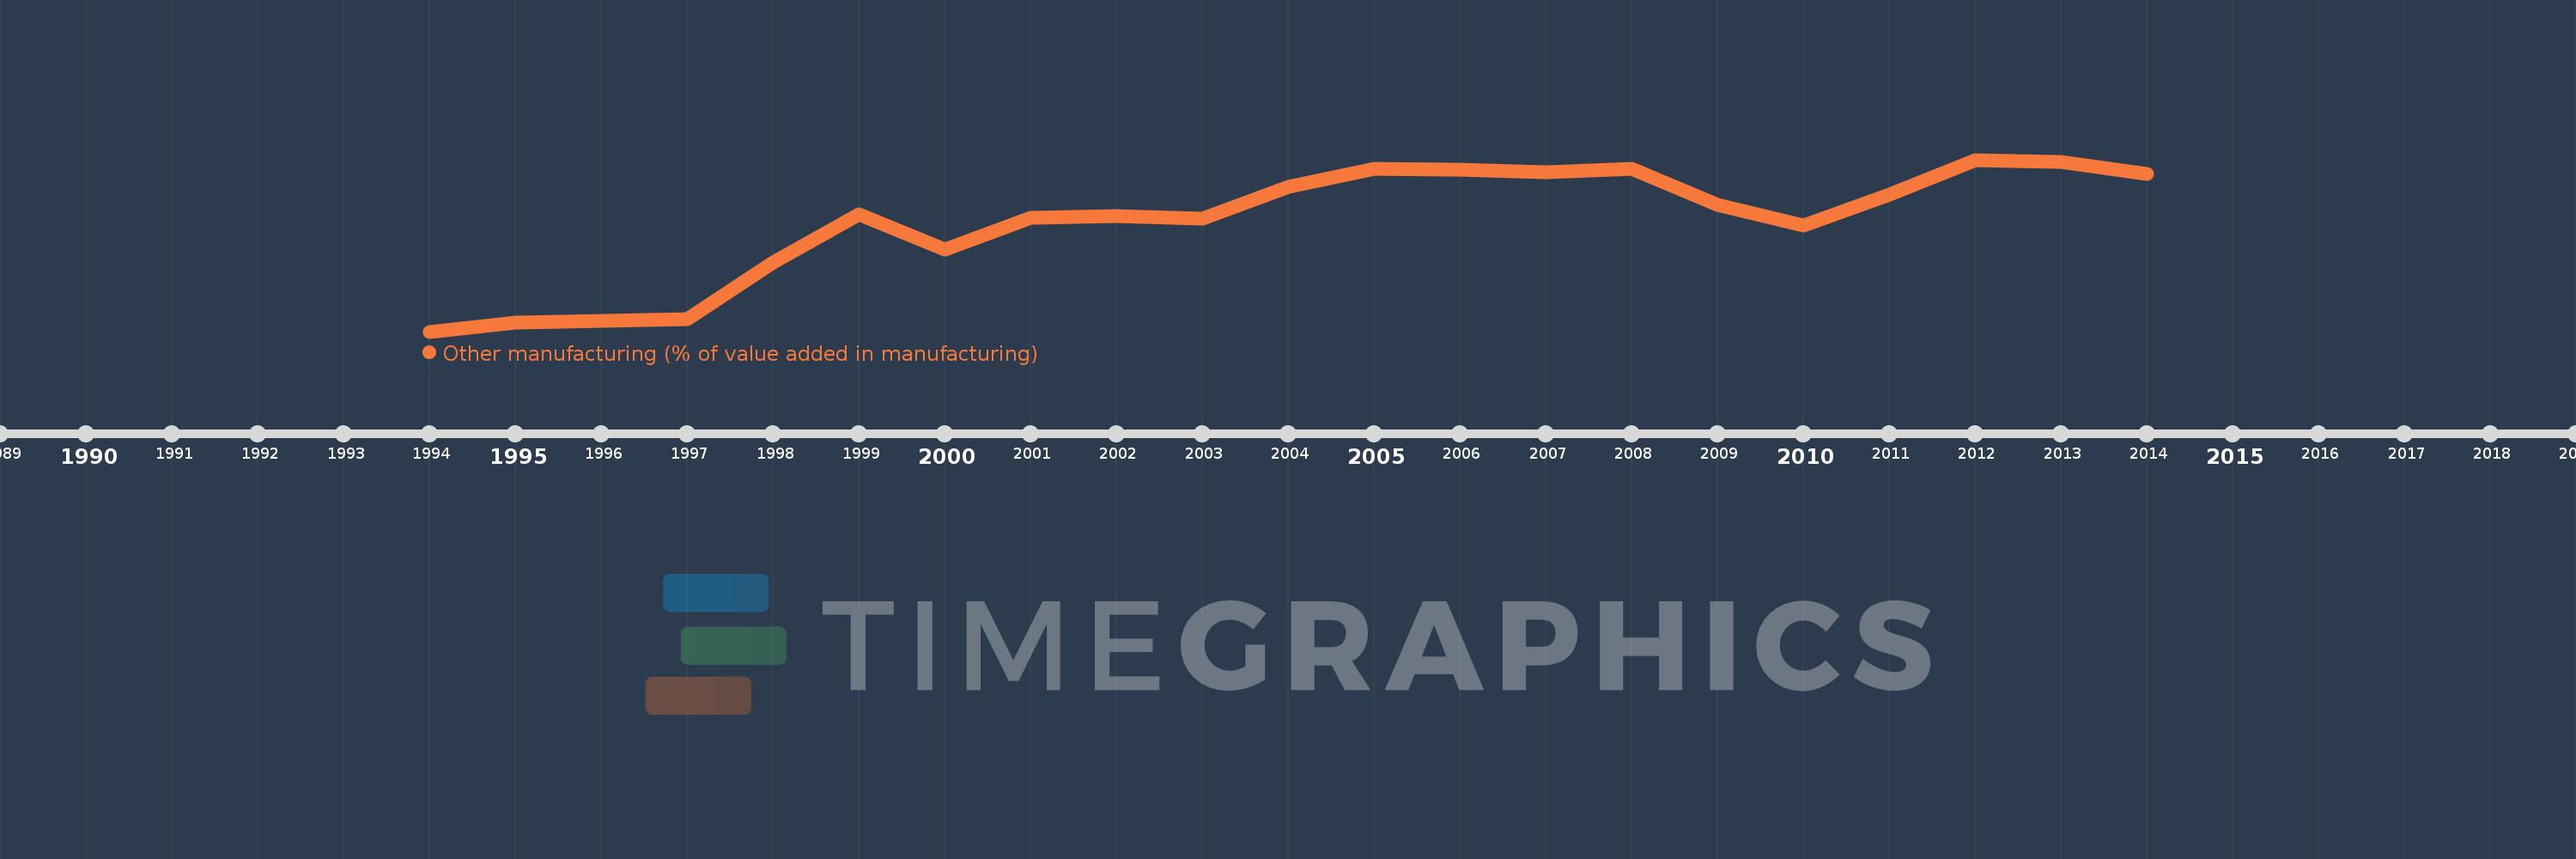
Questa scala temporale mostra un grafico dal 1994 anno al 2014 anno. Latvia. I dati fino ad 1993 anno non disponibili. Il numero di osservazioni attuali secondo i date: 21.
La fonte (nome):
Indicatori dello sviluppo mondiale
La fonte (organizzazione):
United Nations Industrial Development Organization, International Yearbook of Industrial Statistics.
Categorie:
Economy & Growth
sono stati aggiornati
23 apr 2017 anni
Indicatori delle variazioni dei valori per anni
In media:
50.502
Minima:
31.275
1 gen 1994 anni
Massimo:
61.4
1 gen 2012 anni
Alla data di osservazione
Valore
Variazione assoluta
La variazione rispetto al valore precedente
1 gen 1994 anni
31.275
+31.275
0.0%
1 gen 1995 anni
32.865
+1.589
5.08%
1 gen 1996 anni
33.128
+0.263
0.8%
1 gen 1997 anni
33.394
+0.266
0.8%
1 gen 1998 anni
43.362
+9.968
29.85%
1 gen 1999 anni
51.892
+8.53
19.67%
1 gen 2000 anni
45.622
-6.271
-12.08%
1 gen 2001 anni
51.285
+5.664
12.41%
1 gen 2002 anni
51.595
+0.31
0.6%
1 gen 2003 anni
51.087
-0.509
-0.99%
1 gen 2004 anni
56.606
+5.519
10.8%
1 gen 2005 anni
59.77
+3.164
5.59%
1 gen 2006 anni
59.696
-0.074
-0.12%
1 gen 2007 anni
59.169
-0.527
-0.88%
1 gen 2008 anni
59.846
+0.677
1.14%
1 gen 2009 anni
53.434
-6.413
-10.72%
1 gen 2010 anni
49.847
-3.586
-6.71%
1 gen 2011 anni
55.238
+5.39
10.81%
1 gen 2012 anni
61.4
+6.162
11.16%
1 gen 2013 anni
61.032
-0.368
-0.6%
1 gen 2014 anni
58.99
-2.042
-3.35%
Classificazione dei paesi secondo i statistiche attuali per anni