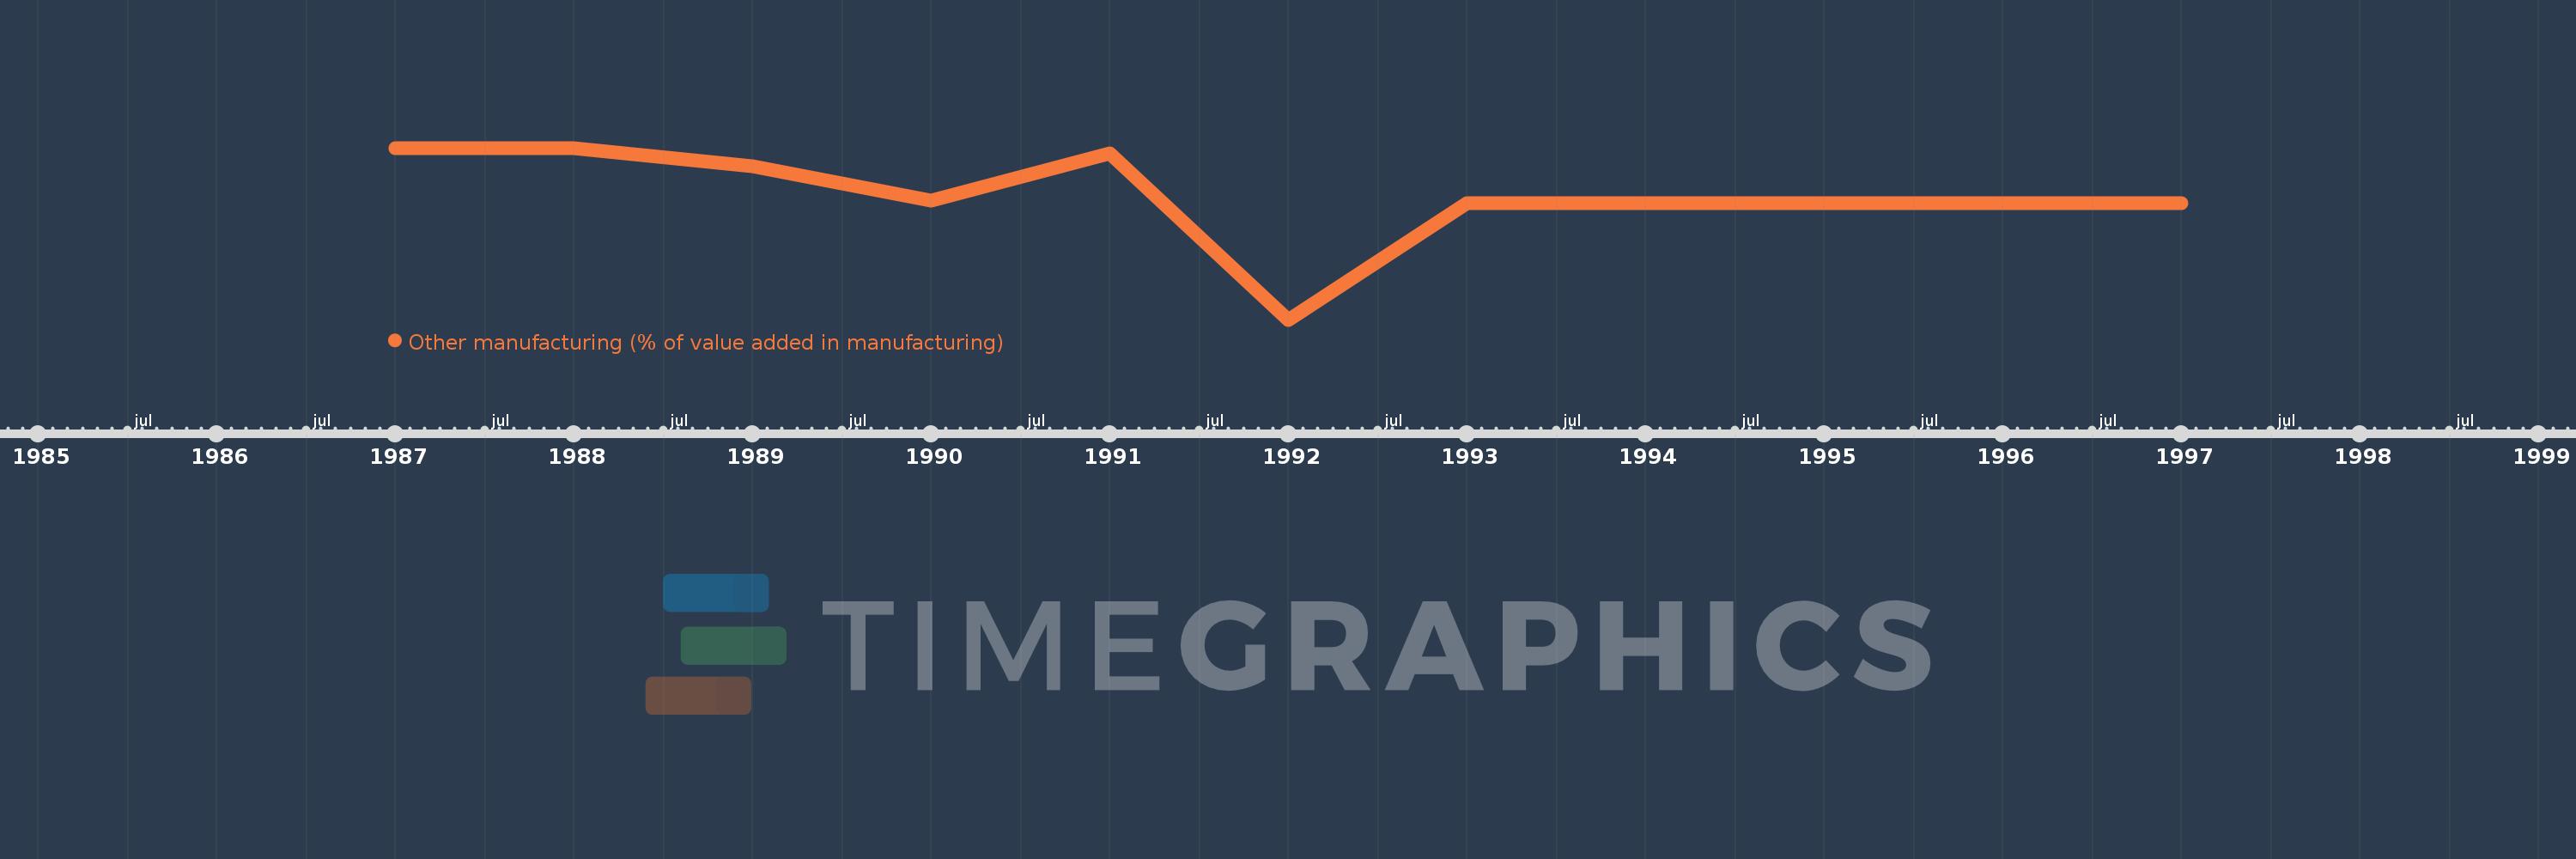
Questa scala temporale mostra un grafico dal 1987 anno al 1997 anno. Croatia. I dati fino ad 1986 anno non disponibili. Il numero di osservazioni attuali secondo i date: 11.
La fonte (nome):
Indicatori dello sviluppo mondiale
La fonte (organizzazione):
United Nations Industrial Development Organization, International Yearbook of Industrial Statistics.
Categorie:
Economy & Growth
sono stati aggiornati
23 apr 2017 anni
Indicatori delle variazioni dei valori per anni
In media:
39.868
Minima:
29.939
1 gen 1992 anni
Massimo:
43.657
1 gen 1987 anni
Alla data di osservazione
Valore
Variazione assoluta
La variazione rispetto al valore precedente
1 gen 1987 anni
43.657
+43.657
0.0%
1 gen 1988 anni
43.656
-0.001
0.0%
1 gen 1989 anni
42.203
-1.453
-3.33%
1 gen 1990 anni
39.445
-2.758
-6.54%
1 gen 1991 anni
43.253
+3.808
9.65%
1 gen 1992 anni
29.939
-13.314
-30.78%
1 gen 1993 anni
39.278
+9.339
31.19%
1 gen 1994 anni
39.278
0.0
0.0%
1 gen 1995 anni
39.278
0.0
0.0%
1 gen 1996 anni
39.278
0.0
0.0%
1 gen 1997 anni
39.278
+0.0
0.0%
Classificazione dei paesi secondo i statistiche attuali per anni