29
/
en
AIzaSyAYiBZKx7MnpbEhh9jyipgxe19OcubqV5w
April 1, 2024
99482
Cameroon
CMR
true
2
1
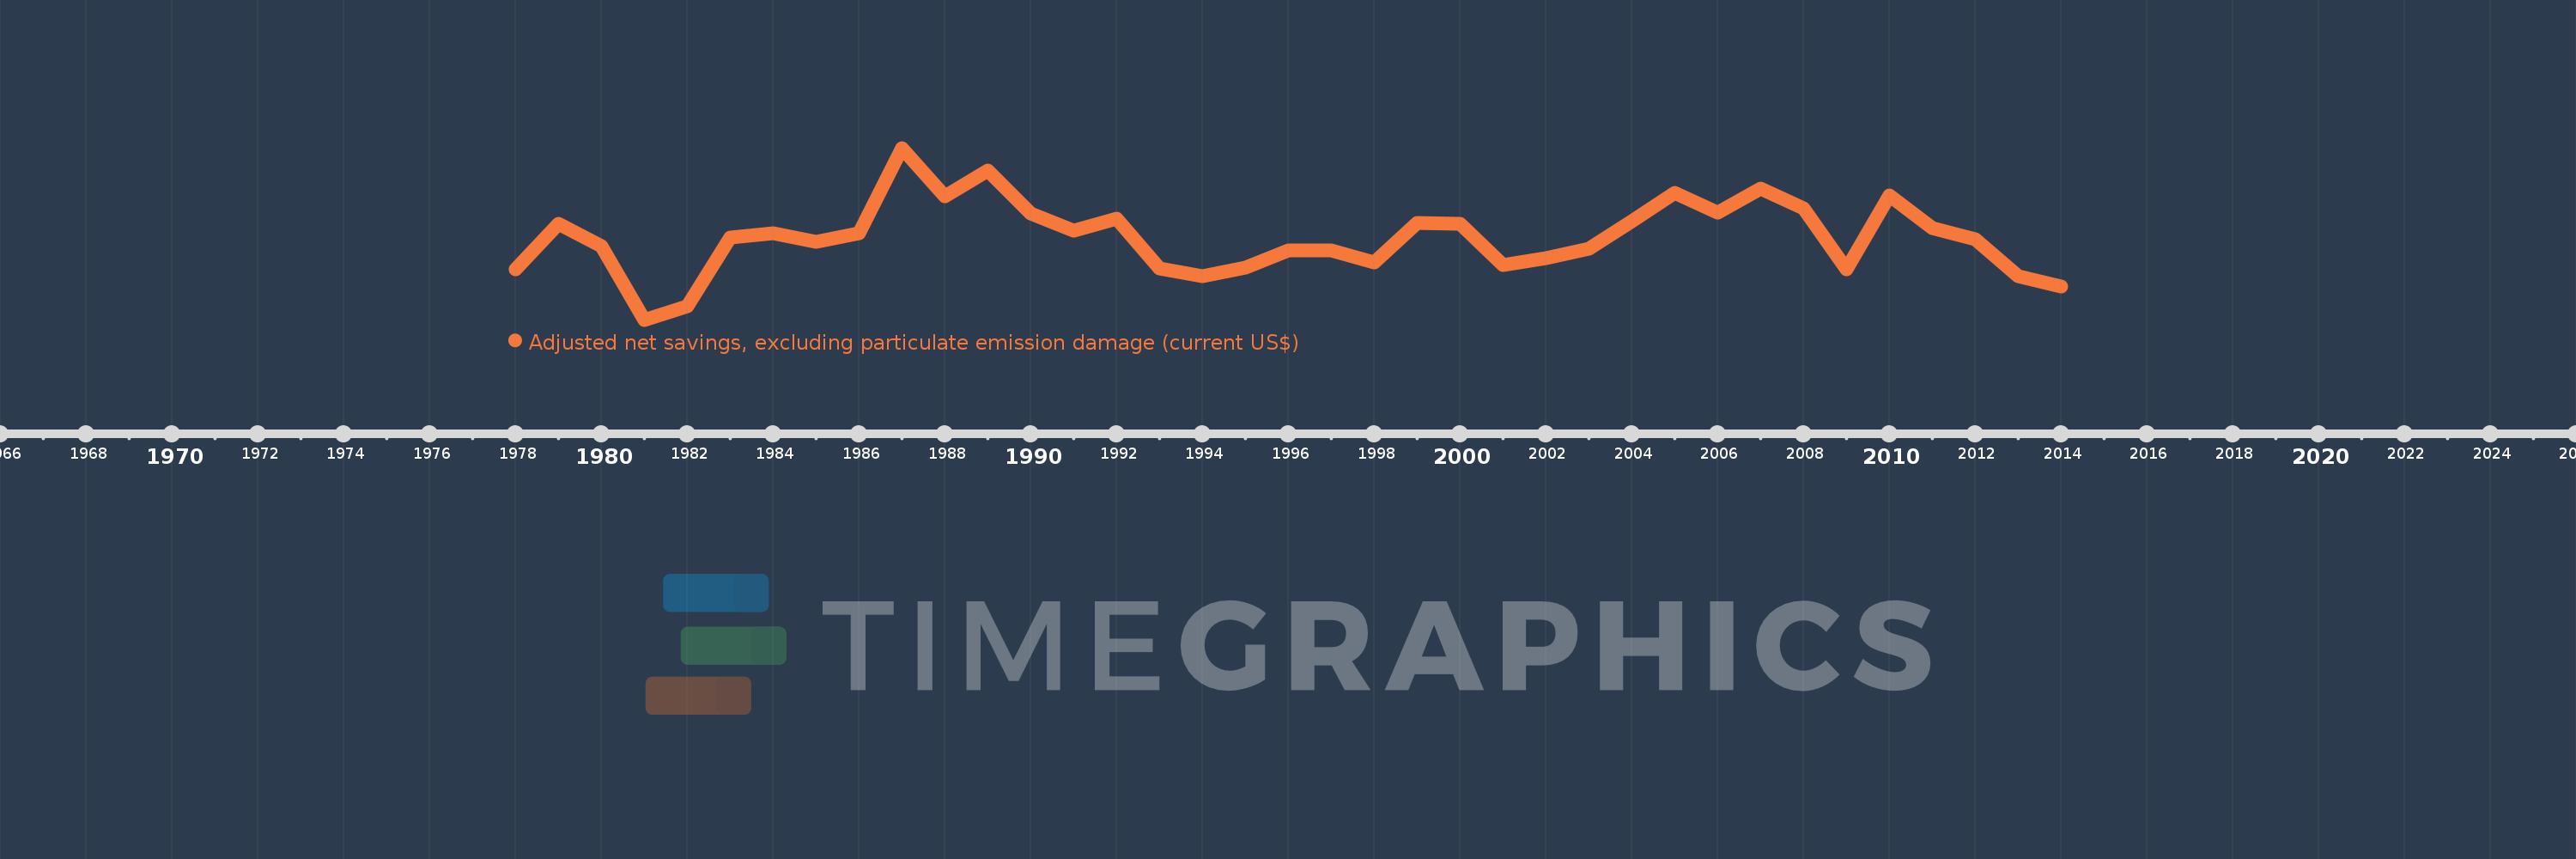
Adjusted net savings, excluding particulate emission damage (current US$)
2014,2013,2012,2011,2010,2009,2008,2007,2006,2005,2004,2003,2002,2001,2000,1999,1998,1997,1996,1995,1994,1993,1992,1991,1990,1989,1988,1987,1986,1985,1984,1983,1982,1981,1980,1979,1978
This statistics in other country:
AfghanistanAlbaniaAlgeriaAngolaArgentinaArmeniaAustraliaAustriaAzerbaijanBahamas, TheBahrainBangladeshBarbadosBelarusBelgiumBelizeBeninBhutanBoliviaBotswanaBrazilBrunei DarussalamBulgariaBurkina FasoBurundiCabo VerdeCambodiaCameroonCanadaCentral African RepublicChadChileChinaColombiaComorosCongo, Dem. Rep.Congo, Rep.Costa RicaCote d'IvoireCroatiaCyprusCzech RepublicDenmarkDjiboutiDominicaDominican RepublicEcuadorEgypt, Arab Rep.El SalvadorEquatorial GuineaEritreaEstoniaEthiopiaFijiFinlandFranceGabonGambia, TheGeorgiaGermanyGhanaGreeceGuatemalaGuineaGuinea-BissauGuyanaHaitiHondurasHungaryIcelandIndiaIndonesiaIran, Islamic Rep.IraqIrelandIsraelItalyJamaicaJapanJordanKazakhstanKenyaKiribatiKorea, Rep.KuwaitKyrgyz RepublicLao PDRLatviaLebanonLesothoLiberiaLibyaLithuaniaLuxembourgMacedonia, FYRMadagascarMalawiMalaysiaMaldivesMaliMauritaniaMauritiusMexicoMoldovaMongoliaMoroccoMozambiqueNamibiaNepalNetherlandsNew ZealandNicaraguaNigerNigeriaNorwayOmanPakistanPanamaPapua New GuineaParaguayPeruPhilippinesPolandPortugalQatarRomaniaRussian FederationRwandaSaudi ArabiaSenegalSeychellesSierra LeoneSingaporeSlovak RepublicSloveniaSolomon IslandsSouth AfricaSpainSri LankaSt. LuciaSt. Vincent and the GrenadinesSudanSurinameSwazilandSwedenSwitzerlandSyrian Arab RepublicTajikistanTanzaniaThailandTogoTongaTrinidad and TobagoTunisiaTurkeyUgandaUkraineUnited KingdomUnited StatesUruguayVanuatuVenezuela, RBVietnamYemen, Rep.ZambiaZimbabwe Timeline:
This timeline shows a graph from 1978 to 2014 of Cameroon. No data until 1977. Number of actual observations by date: 37.
Source name:
World Development Indicators
Source organization:
World Bank staff estimates based on sources and methods in World Bank's "The Changing Wealth of Nations: Measuring Sustainable Development in the New Millennium" (2011).
Categories, topics:
Economy & Growth, Environment
Last updated:
apr 23, 2017
Indicators value changes by year
Minimum:
-791.269 mln
jan 1, 1981
Maximum:
1.678 bln
jan 1, 1987
At the date of observation
Value
Absolute change
Change from previous value
jan 1, 1978
-70.518 mln
-70.518 mln
0.0%
jan 1, 1979
587.568 mln
+658.087 mln
-933.21%
jan 1, 1980
264.904 mln
-322.664 mln
-54.92%
jan 1, 1981
-791.269 mln
-1.056 bln
-398.7%
jan 1, 1982
-595.342 mln
+195.927 mln
-24.76%
jan 1, 1983
394.625 mln
+989.967 mln
-166.29%
jan 1, 1984
450.615 mln
+55.989 mln
14.19%
jan 1, 1985
327.282 mln
-123.332 mln
-27.37%
jan 1, 1986
456.214 mln
+128.931 mln
39.39%
jan 1, 1987
1.678 bln
+1.222 bln
267.75%
jan 1, 1988
987.961 mln
-689.768 mln
-41.11%
jan 1, 1989
1.355 bln
+366.666 mln
37.11%
jan 1, 1990
736.668 mln
-617.959 mln
-45.62%
jan 1, 1991
482.782 mln
-253.886 mln
-34.46%
jan 1, 1992
660.881 mln
+178.098 mln
36.89%
jan 1, 1993
-56.696 mln
-717.577 mln
-108.58%
jan 1, 1994
-171.525 mln
-114.829 mln
202.53%
jan 1, 1995
-42.095 mln
+129.43 mln
-75.46%
jan 1, 1996
208.875 mln
+250.97 mln
-596.19%
jan 1, 1997
199.241 mln
-9.634 mln
-4.61%
jan 1, 1998
33.232 mln
-166.008 mln
-83.32%
jan 1, 1999
595.745 mln
+562.513 mln
1.69K%
jan 1, 2000
582.209 mln
-13.537 mln
-2.27%
jan 1, 2001
-2.074 mln
-584.283 mln
-100.36%
jan 1, 2002
98.786 mln
+100.86 mln
-4.86K%
jan 1, 2003
234.727 mln
+135.941 mln
137.61%
jan 1, 2004
627.256 mln
+392.529 mln
167.23%
jan 1, 2005
1.026 bln
+398.959 mln
63.6%
jan 1, 2006
748.567 mln
-277.648 mln
-27.06%
jan 1, 2007
1.091 bln
+342.835 mln
45.8%
jan 1, 2008
810.276 mln
-281.125 mln
-25.76%
jan 1, 2009
-64.93 mln
-875.206 mln
-108.01%
jan 1, 2010
997.633 mln
+1.063 bln
-1.64K%
jan 1, 2011
526.414 mln
-471.22 mln
-47.23%
jan 1, 2012
360.547 mln
-165.867 mln
-31.51%
jan 1, 2013
-168.53 mln
-529.077 mln
-146.74%
jan 1, 2014
-308.218 mln
-139.687 mln
82.89%
Ranking of countries by current statistics by years


Comments: