29
/
en
AIzaSyAYiBZKx7MnpbEhh9jyipgxe19OcubqV5w
April 1, 2024
81439
Belgium
BEL
true
2
1
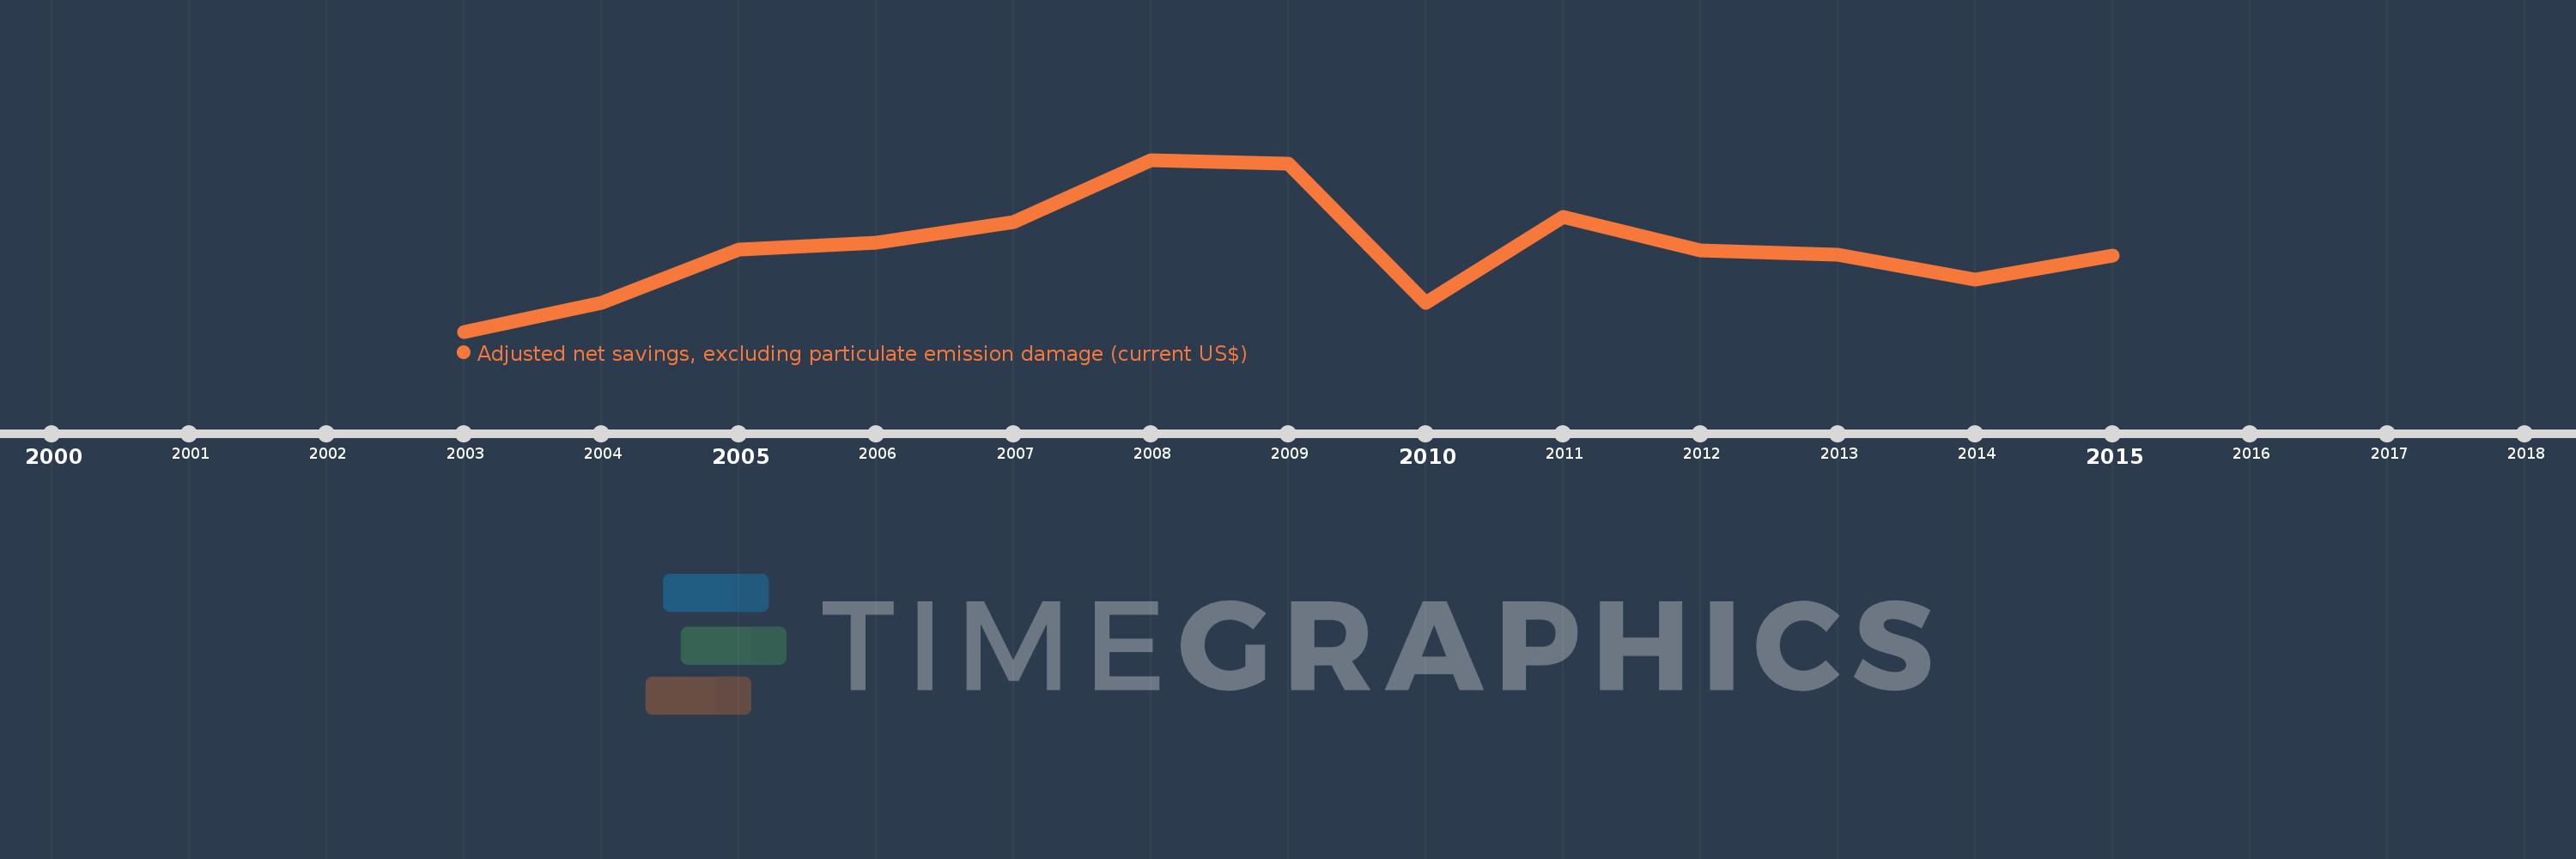
Adjusted net savings, excluding particulate emission damage (current US$)
2015,2014,2013,2012,2011,2010,2009,2008,2007,2006,2005,2004,2003
This statistics in other country:
AfghanistanAlbaniaAlgeriaAngolaArgentinaArmeniaAustraliaAustriaAzerbaijanBahamas, TheBahrainBangladeshBarbadosBelarusBelgiumBelizeBeninBhutanBoliviaBotswanaBrazilBrunei DarussalamBulgariaBurkina FasoBurundiCabo VerdeCambodiaCameroonCanadaCentral African RepublicChadChileChinaColombiaComorosCongo, Dem. Rep.Congo, Rep.Costa RicaCote d'IvoireCroatiaCyprusCzech RepublicDenmarkDjiboutiDominicaDominican RepublicEcuadorEgypt, Arab Rep.El SalvadorEquatorial GuineaEritreaEstoniaEthiopiaFijiFinlandFranceGabonGambia, TheGeorgiaGermanyGhanaGreeceGuatemalaGuineaGuinea-BissauGuyanaHaitiHondurasHungaryIcelandIndiaIndonesiaIran, Islamic Rep.IraqIrelandIsraelItalyJamaicaJapanJordanKazakhstanKenyaKiribatiKorea, Rep.KuwaitKyrgyz RepublicLao PDRLatviaLebanonLesothoLiberiaLibyaLithuaniaLuxembourgMacedonia, FYRMadagascarMalawiMalaysiaMaldivesMaliMauritaniaMauritiusMexicoMoldovaMongoliaMoroccoMozambiqueNamibiaNepalNetherlandsNew ZealandNicaraguaNigerNigeriaNorwayOmanPakistanPanamaPapua New GuineaParaguayPeruPhilippinesPolandPortugalQatarRomaniaRussian FederationRwandaSaudi ArabiaSenegalSeychellesSierra LeoneSingaporeSlovak RepublicSloveniaSolomon IslandsSouth AfricaSpainSri LankaSt. LuciaSt. Vincent and the GrenadinesSudanSurinameSwazilandSwedenSwitzerlandSyrian Arab RepublicTajikistanTanzaniaThailandTogoTongaTrinidad and TobagoTunisiaTurkeyUgandaUkraineUnited KingdomUnited StatesUruguayVanuatuVenezuela, RBVietnamYemen, Rep.ZambiaZimbabwe Timeline:
This timeline shows a graph from 2003 to 2015 of Belgium. No data until 2002. Number of actual observations by date: 13.
Source name:
World Development Indicators
Source organization:
World Bank staff estimates based on sources and methods in World Bank's "The Changing Wealth of Nations: Measuring Sustainable Development in the New Millennium" (2011).
Categories, topics:
Economy & Growth, Environment
Last updated:
apr 23, 2017
Indicators value changes by year
Minimum:
37.822 bln
jan 1, 2003
Maximum:
74.297 bln
jan 1, 2008
At the date of observation
Value
Absolute change
Change from previous value
jan 1, 2003
37.822 bln
+37.822 bln
0.0%
jan 1, 2004
43.921 bln
+6.099 bln
16.13%
jan 1, 2005
55.243 bln
+11.322 bln
25.78%
jan 1, 2006
56.746 bln
+1.503 bln
2.72%
jan 1, 2007
61.008 bln
+4.263 bln
7.51%
jan 1, 2008
74.297 bln
+13.289 bln
21.78%
jan 1, 2009
73.4 bln
-896.5 mln
-1.21%
jan 1, 2010
44.018 bln
-29.383 bln
-40.03%
jan 1, 2011
62.222 bln
+18.205 bln
41.36%
jan 1, 2012
54.977 bln
-7.245 bln
-11.64%
jan 1, 2013
54.227 bln
-750.058 mln
-1.36%
jan 1, 2014
48.79 bln
-5.437 bln
-10.03%
jan 1, 2015
53.899 bln
+5.109 bln
10.47%
Ranking of countries by current statistics by years


Comments: