29
/
en
AIzaSyAYiBZKx7MnpbEhh9jyipgxe19OcubqV5w
April 1, 2024
253829
Suriname
SUR
true
2
1
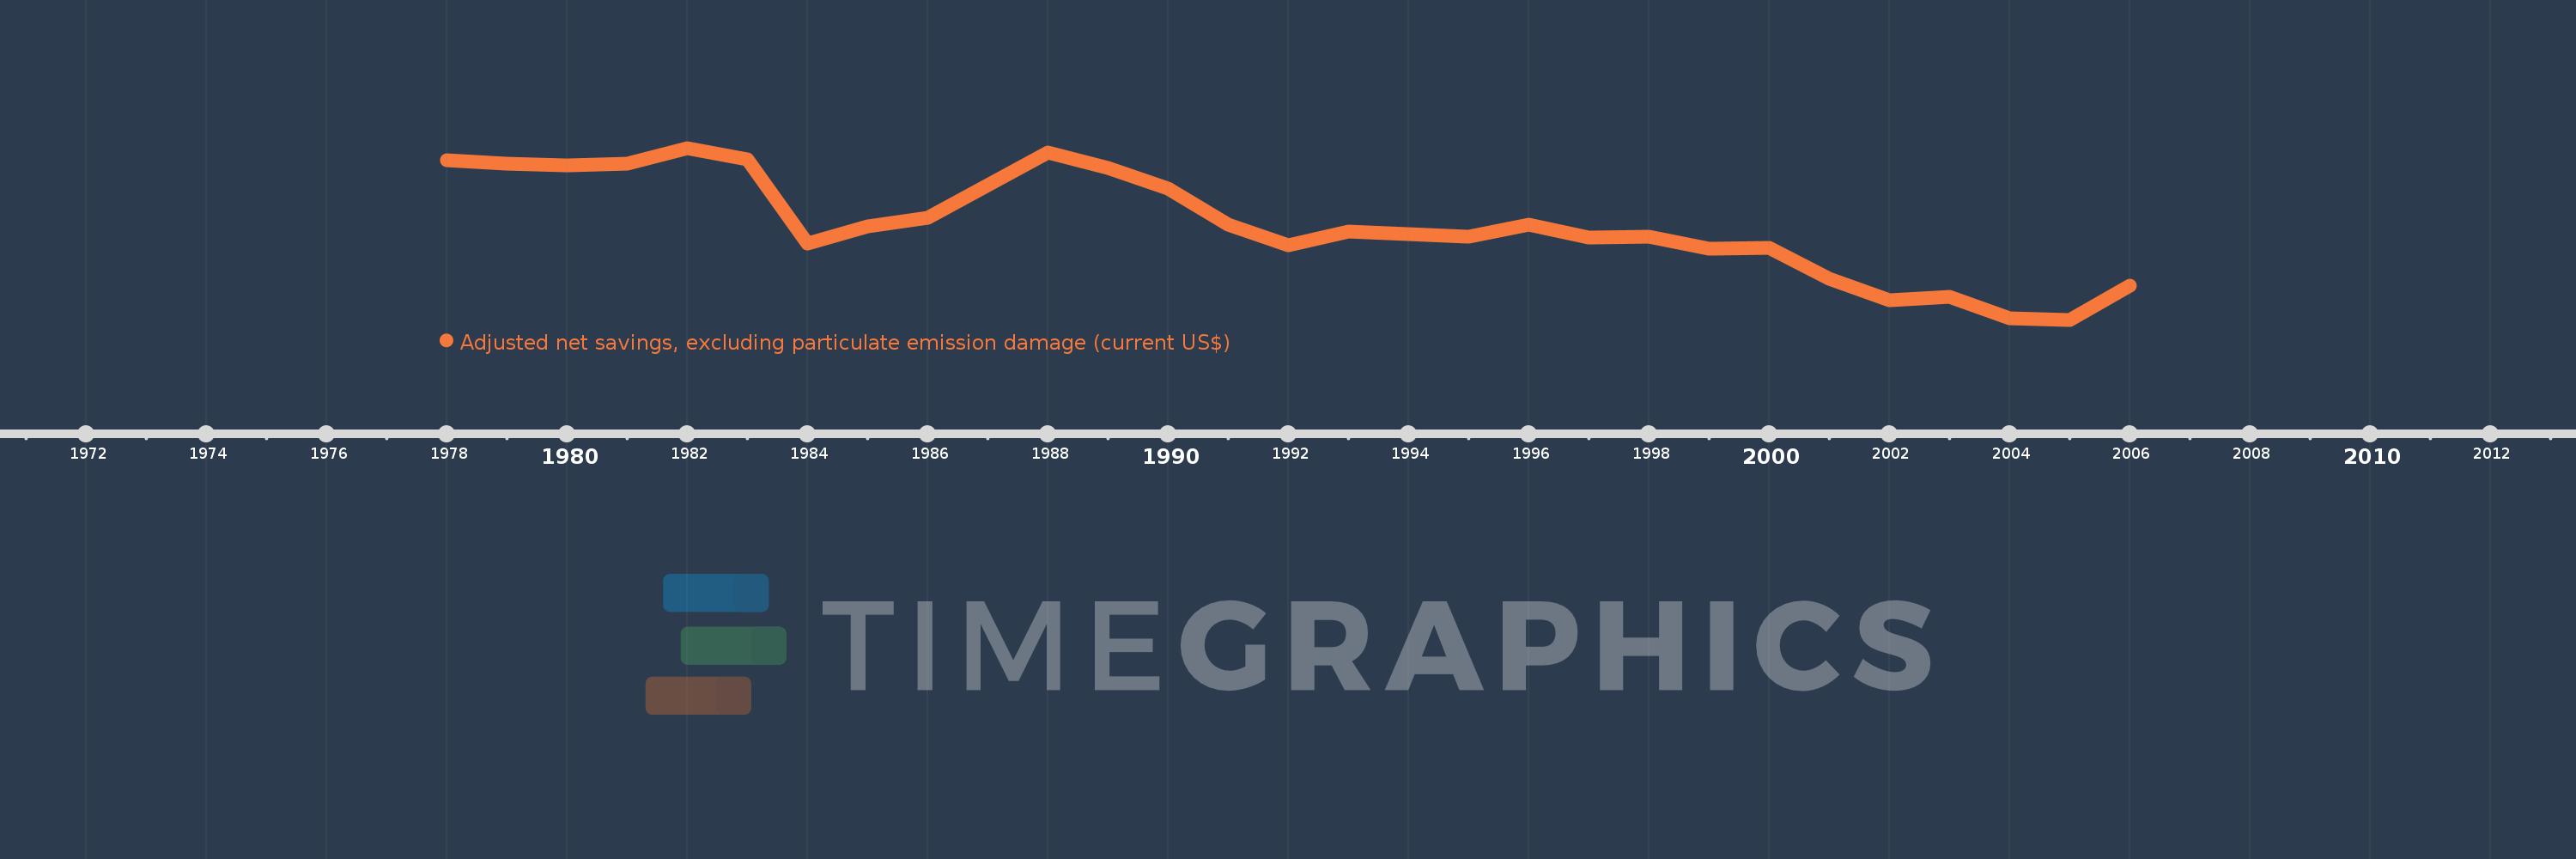
Adjusted net savings, excluding particulate emission damage (current US$)
2006,2005,2004,2003,2002,2001,2000,1999,1998,1997,1996,1995,1993,1992,1991,1990,1989,1988,1987,1986,1985,1984,1983,1982,1981,1980,1979,1978
This statistics in other country:
AfghanistanAlbaniaAlgeriaAngolaArgentinaArmeniaAustraliaAustriaAzerbaijanBahamas, TheBahrainBangladeshBarbadosBelarusBelgiumBelizeBeninBhutanBoliviaBotswanaBrazilBrunei DarussalamBulgariaBurkina FasoBurundiCabo VerdeCambodiaCameroonCanadaCentral African RepublicChadChileChinaColombiaComorosCongo, Dem. Rep.Congo, Rep.Costa RicaCote d'IvoireCroatiaCyprusCzech RepublicDenmarkDjiboutiDominicaDominican RepublicEcuadorEgypt, Arab Rep.El SalvadorEquatorial GuineaEritreaEstoniaEthiopiaFijiFinlandFranceGabonGambia, TheGeorgiaGermanyGhanaGreeceGuatemalaGuineaGuinea-BissauGuyanaHaitiHondurasHungaryIcelandIndiaIndonesiaIran, Islamic Rep.IraqIrelandIsraelItalyJamaicaJapanJordanKazakhstanKenyaKiribatiKorea, Rep.KuwaitKyrgyz RepublicLao PDRLatviaLebanonLesothoLiberiaLibyaLithuaniaLuxembourgMacedonia, FYRMadagascarMalawiMalaysiaMaldivesMaliMauritaniaMauritiusMexicoMoldovaMongoliaMoroccoMozambiqueNamibiaNepalNetherlandsNew ZealandNicaraguaNigerNigeriaNorwayOmanPakistanPanamaPapua New GuineaParaguayPeruPhilippinesPolandPortugalQatarRomaniaRussian FederationRwandaSaudi ArabiaSenegalSeychellesSierra LeoneSingaporeSlovak RepublicSloveniaSolomon IslandsSouth AfricaSpainSri LankaSt. LuciaSt. Vincent and the GrenadinesSudanSurinameSwazilandSwedenSwitzerlandSyrian Arab RepublicTajikistanTanzaniaThailandTogoTongaTrinidad and TobagoTunisiaTurkeyUgandaUkraineUnited KingdomUnited StatesUruguayVanuatuVenezuela, RBVietnamYemen, Rep.ZambiaZimbabwe Timeline:
This timeline shows a graph from 1978 to 2006 of Suriname. No data until 1977. Number of actual observations by date: 28.
Source name:
World Development Indicators
Source organization:
World Bank staff estimates based on sources and methods in World Bank's "The Changing Wealth of Nations: Measuring Sustainable Development in the New Millennium" (2011).
Categories, topics:
Economy & Growth, Environment
Last updated:
apr 23, 2017
Indicators value changes by year
Minimum:
-322.9 mln
jan 1, 2005
Maximum:
263.59 mln
jan 1, 1982
At the date of observation
Value
Absolute change
Change from previous value
jan 1, 1978
220.715 mln
+220.715 mln
0.0%
jan 1, 1979
210.926 mln
-9.79 mln
-4.44%
jan 1, 1980
204.761 mln
-6.164 mln
-2.92%
jan 1, 1981
208.646 mln
+3.885 mln
1.9%
jan 1, 1982
263.59 mln
+54.944 mln
26.33%
jan 1, 1983
225.295 mln
-38.295 mln
-14.53%
jan 1, 1984
-64.215 mln
-289.51 mln
-128.5%
jan 1, 1985
-4.145 mln
+60.07 mln
-93.54%
jan 1, 1986
25.165 mln
+29.31 mln
-707.08%
jan 1, 1987
136.519 mln
+111.354 mln
442.5%
jan 1, 1988
247.158 mln
+110.639 mln
81.04%
jan 1, 1989
195.129 mln
-52.029 mln
-21.05%
jan 1, 1990
125.575 mln
-69.554 mln
-35.65%
jan 1, 1991
1.566 mln
-124.008 mln
-98.75%
jan 1, 1992
-67.333 mln
-68.899 mln
-4.4K%
jan 1, 1993
-21.576 mln
+45.756 mln
-67.96%
jan 1, 1995
-39.912 mln
-18.335 mln
84.98%
jan 1, 1996
2.115 mln
+42.026 mln
-105.3%
jan 1, 1997
-42.625 mln
-44.74 mln
-2.12K%
jan 1, 1998
-39.12 mln
+3.505 mln
-8.22%
jan 1, 1999
-81.247 mln
-42.127 mln
107.69%
jan 1, 2000
-78.496 mln
+2.751 mln
-3.39%
jan 1, 2001
-181.677 mln
-103.181 mln
131.45%
jan 1, 2002
-257.72 mln
-76.043 mln
41.86%
jan 1, 2003
-244.361 mln
+13.359 mln
-5.18%
jan 1, 2004
-317.207 mln
-72.847 mln
29.81%
jan 1, 2005
-322.9 mln
-5.693 mln
1.79%
jan 1, 2006
-206.054 mln
+116.846 mln
-36.19%
Ranking of countries by current statistics by years


Comments: