29
/
en
AIzaSyAYiBZKx7MnpbEhh9jyipgxe19OcubqV5w
April 1, 2024
250445
St. Lucia
LCA
true
2
1
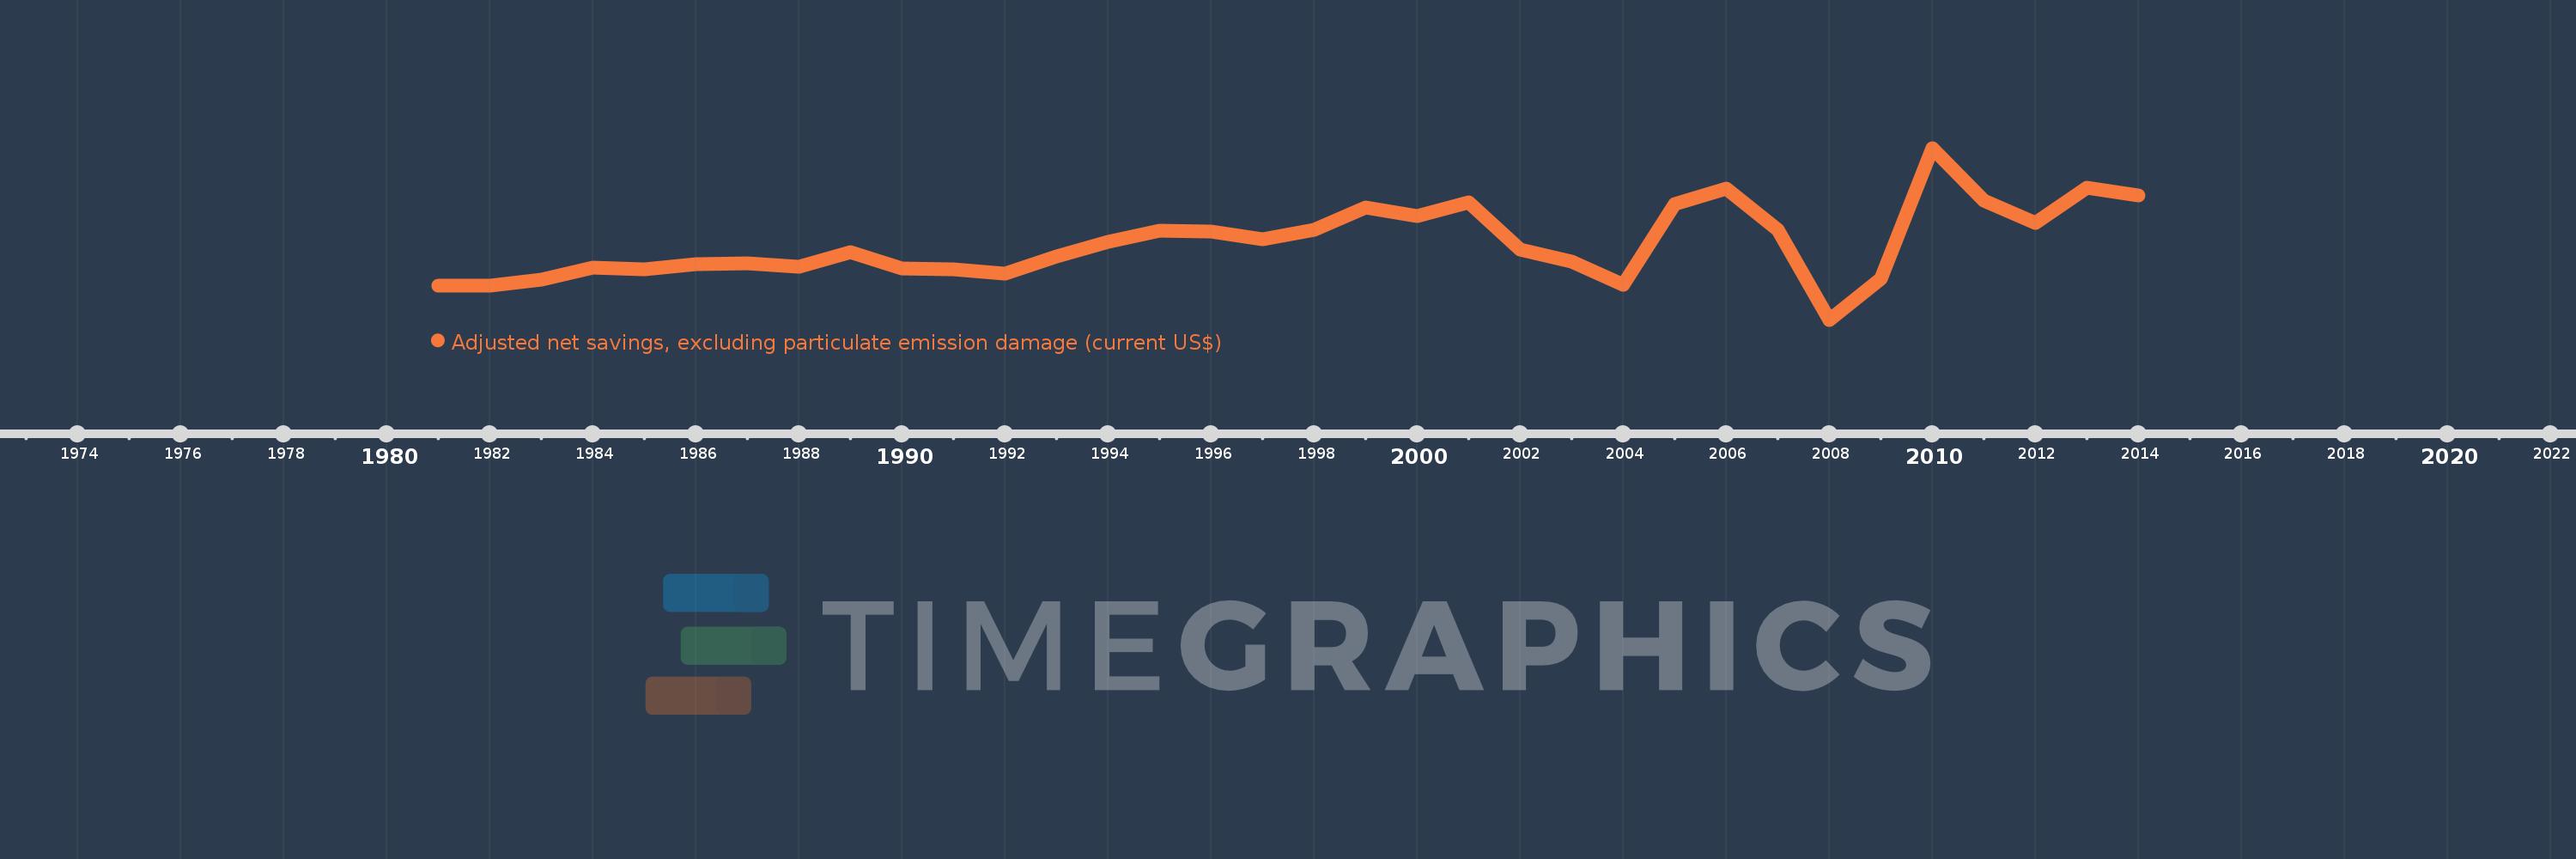
Adjusted net savings, excluding particulate emission damage (current US$)
2014,2013,2012,2011,2010,2009,2008,2007,2006,2005,2004,2003,2002,2001,2000,1999,1998,1997,1996,1995,1994,1993,1992,1991,1990,1989,1988,1987,1986,1985,1984,1983,1982,1981
This statistics in other country:
AfghanistanAlbaniaAlgeriaAngolaArgentinaArmeniaAustraliaAustriaAzerbaijanBahamas, TheBahrainBangladeshBarbadosBelarusBelgiumBelizeBeninBhutanBoliviaBotswanaBrazilBrunei DarussalamBulgariaBurkina FasoBurundiCabo VerdeCambodiaCameroonCanadaCentral African RepublicChadChileChinaColombiaComorosCongo, Dem. Rep.Congo, Rep.Costa RicaCote d'IvoireCroatiaCyprusCzech RepublicDenmarkDjiboutiDominicaDominican RepublicEcuadorEgypt, Arab Rep.El SalvadorEquatorial GuineaEritreaEstoniaEthiopiaFijiFinlandFranceGabonGambia, TheGeorgiaGermanyGhanaGreeceGuatemalaGuineaGuinea-BissauGuyanaHaitiHondurasHungaryIcelandIndiaIndonesiaIran, Islamic Rep.IraqIrelandIsraelItalyJamaicaJapanJordanKazakhstanKenyaKiribatiKorea, Rep.KuwaitKyrgyz RepublicLao PDRLatviaLebanonLesothoLiberiaLibyaLithuaniaLuxembourgMacedonia, FYRMadagascarMalawiMalaysiaMaldivesMaliMauritaniaMauritiusMexicoMoldovaMongoliaMoroccoMozambiqueNamibiaNepalNetherlandsNew ZealandNicaraguaNigerNigeriaNorwayOmanPakistanPanamaPapua New GuineaParaguayPeruPhilippinesPolandPortugalQatarRomaniaRussian FederationRwandaSaudi ArabiaSenegalSeychellesSierra LeoneSingaporeSlovak RepublicSloveniaSolomon IslandsSouth AfricaSpainSri LankaSt. LuciaSt. Vincent and the GrenadinesSudanSurinameSwazilandSwedenSwitzerlandSyrian Arab RepublicTajikistanTanzaniaThailandTogoTongaTrinidad and TobagoTunisiaTurkeyUgandaUkraineUnited KingdomUnited StatesUruguayVanuatuVenezuela, RBVietnamYemen, Rep.ZambiaZimbabwe Timeline:
This timeline shows a graph from 1981 to 2014 of St. Lucia. No data until 1980. Number of actual observations by date: 34.
Source name:
World Development Indicators
Source organization:
World Bank staff estimates based on sources and methods in World Bank's "The Changing Wealth of Nations: Measuring Sustainable Development in the New Millennium" (2011).
Categories, topics:
Economy & Growth, Environment
Last updated:
apr 23, 2017
Indicators value changes by year
Minimum:
-15.854 mln
jan 1, 2008
Maximum:
191.872 mln
jan 1, 2010
At the date of observation
Value
Absolute change
Change from previous value
jan 1, 1981
25.626 mln
+25.626 mln
0.0%
jan 1, 1982
25.192 mln
-433.489K
-1.69%
jan 1, 1983
33.165 mln
+7.972 mln
31.65%
jan 1, 1984
47.683 mln
+14.518 mln
43.78%
jan 1, 1985
45.098 mln
-2.585 mln
-5.42%
jan 1, 1986
51.632 mln
+6.534 mln
14.49%
jan 1, 1987
52.519 mln
+887.603K
1.72%
jan 1, 1988
48.072 mln
-4.447 mln
-8.47%
jan 1, 1989
65.487 mln
+17.415 mln
36.23%
jan 1, 1990
46.061 mln
-19.426 mln
-29.66%
jan 1, 1991
45.341 mln
-720.01K
-1.56%
jan 1, 1992
40.356 mln
-4.985 mln
-10.99%
jan 1, 1993
60.945 mln
+20.589 mln
51.02%
jan 1, 1994
78.8 mln
+17.854 mln
29.3%
jan 1, 1995
91.795 mln
+12.996 mln
16.49%
jan 1, 1996
91.022 mln
-773.001K
-0.84%
jan 1, 1997
81.066 mln
-9.956 mln
-10.94%
jan 1, 1998
93.131 mln
+12.064 mln
14.88%
jan 1, 1999
119.696 mln
+26.566 mln
28.53%
jan 1, 2000
109.96 mln
-9.736 mln
-8.13%
jan 1, 2001
125.783 mln
+15.823 mln
14.39%
jan 1, 2002
69.132 mln
-56.651 mln
-45.04%
jan 1, 2003
54.469 mln
-14.663 mln
-21.21%
jan 1, 2004
26.722 mln
-27.746 mln
-50.94%
jan 1, 2005
123.591 mln
+96.868 mln
362.5%
jan 1, 2006
143.16 mln
+19.569 mln
15.83%
jan 1, 2007
92.694 mln
-50.466 mln
-35.25%
jan 1, 2008
-15.854 mln
-108.548 mln
-117.1%
jan 1, 2009
34.069 mln
+49.922 mln
-314.89%
jan 1, 2010
191.872 mln
+157.803 mln
463.19%
jan 1, 2011
128.188 mln
-63.684 mln
-33.19%
jan 1, 2012
101.184 mln
-27.003 mln
-21.07%
jan 1, 2013
144.284 mln
+43.1 mln
42.6%
jan 1, 2014
134.261 mln
-10.023 mln
-6.95%
Ranking of countries by current statistics by years


Comments: