29
/
en
AIzaSyAYiBZKx7MnpbEhh9jyipgxe19OcubqV5w
April 1, 2024
254821
Swaziland
SWZ
true
2
1
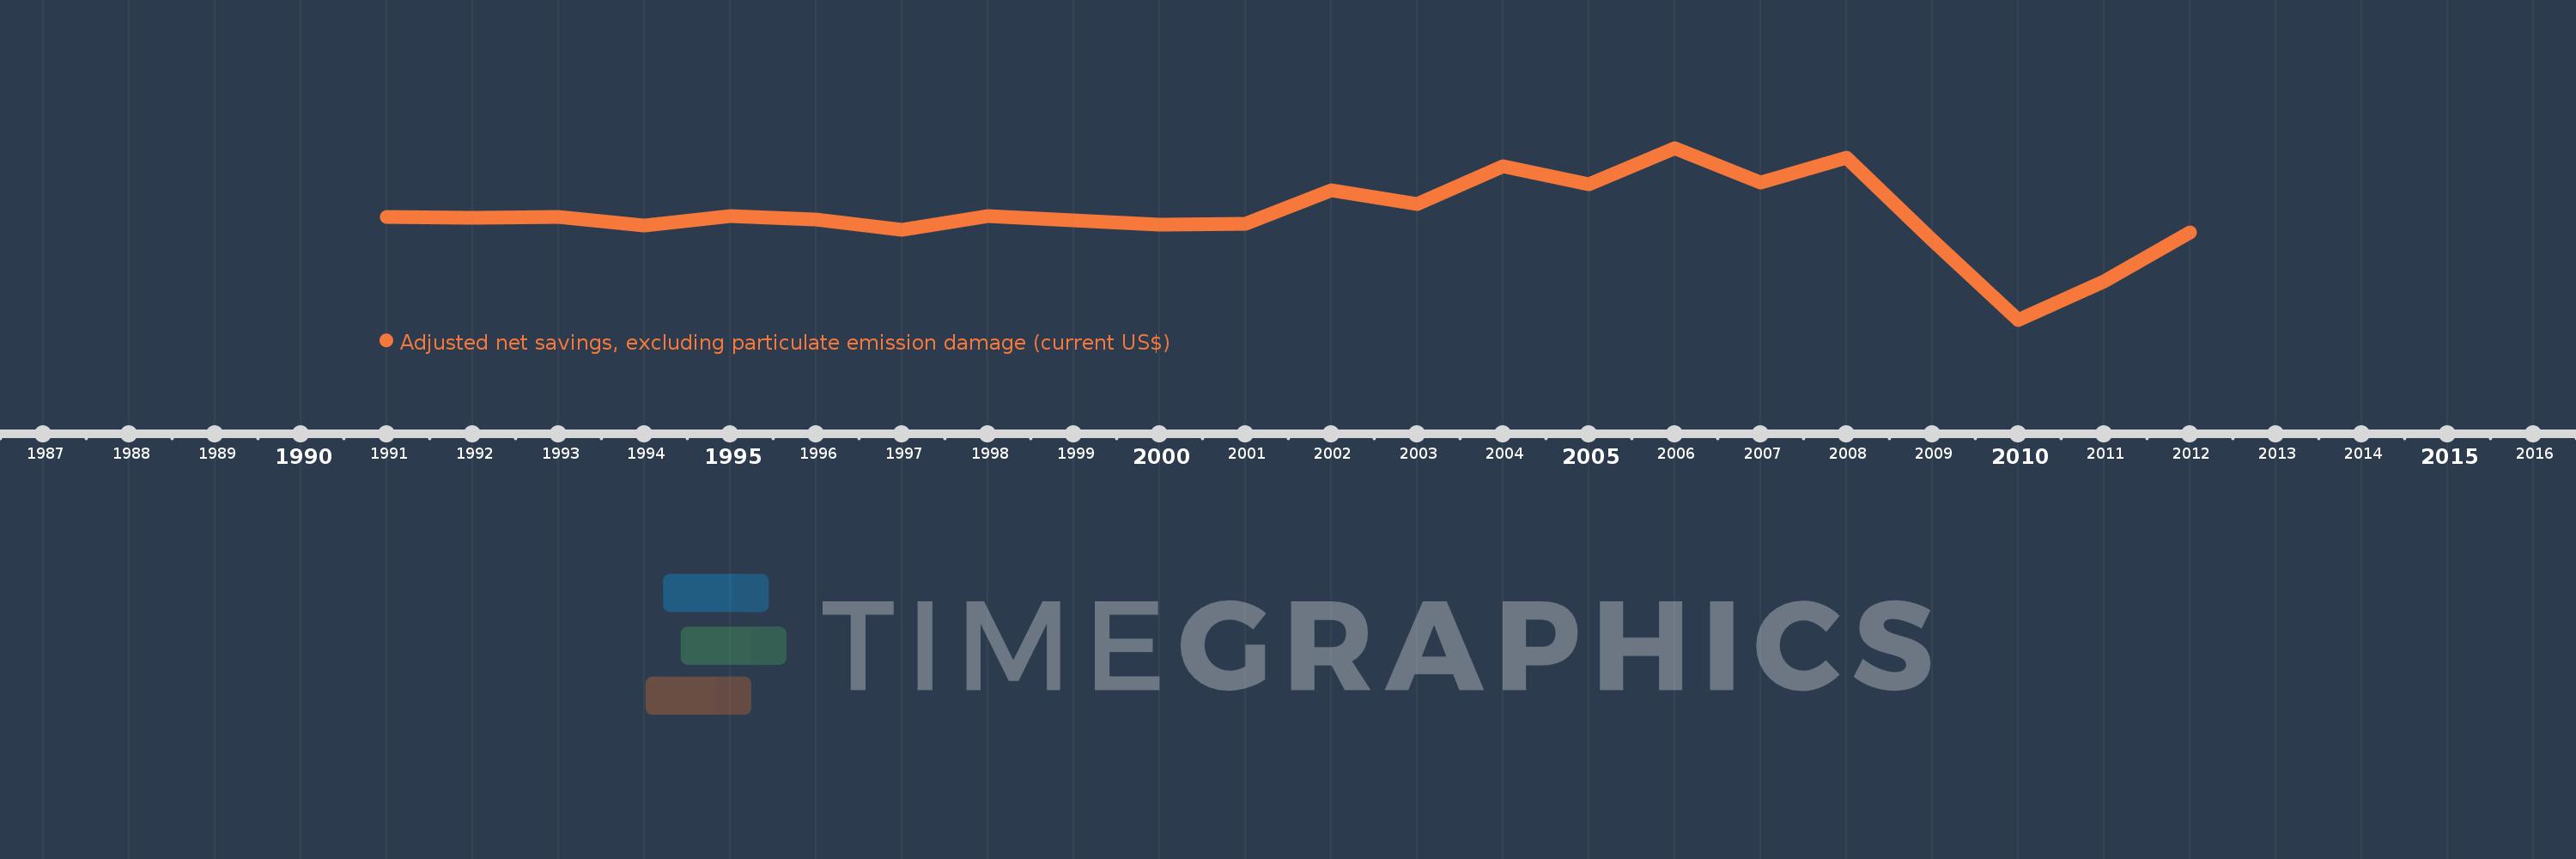
Adjusted net savings, excluding particulate emission damage (current US$)
2012,2011,2010,2009,2008,2007,2006,2005,2004,2003,2002,2001,2000,1999,1998,1997,1996,1995,1994,1993,1992,1991
This statistics in other country:
AfghanistanAlbaniaAlgeriaAngolaArgentinaArmeniaAustraliaAustriaAzerbaijanBahamas, TheBahrainBangladeshBarbadosBelarusBelgiumBelizeBeninBhutanBoliviaBotswanaBrazilBrunei DarussalamBulgariaBurkina FasoBurundiCabo VerdeCambodiaCameroonCanadaCentral African RepublicChadChileChinaColombiaComorosCongo, Dem. Rep.Congo, Rep.Costa RicaCote d'IvoireCroatiaCyprusCzech RepublicDenmarkDjiboutiDominicaDominican RepublicEcuadorEgypt, Arab Rep.El SalvadorEquatorial GuineaEritreaEstoniaEthiopiaFijiFinlandFranceGabonGambia, TheGeorgiaGermanyGhanaGreeceGuatemalaGuineaGuinea-BissauGuyanaHaitiHondurasHungaryIcelandIndiaIndonesiaIran, Islamic Rep.IraqIrelandIsraelItalyJamaicaJapanJordanKazakhstanKenyaKiribatiKorea, Rep.KuwaitKyrgyz RepublicLao PDRLatviaLebanonLesothoLiberiaLibyaLithuaniaLuxembourgMacedonia, FYRMadagascarMalawiMalaysiaMaldivesMaliMauritaniaMauritiusMexicoMoldovaMongoliaMoroccoMozambiqueNamibiaNepalNetherlandsNew ZealandNicaraguaNigerNigeriaNorwayOmanPakistanPanamaPapua New GuineaParaguayPeruPhilippinesPolandPortugalQatarRomaniaRussian FederationRwandaSaudi ArabiaSenegalSeychellesSierra LeoneSingaporeSlovak RepublicSloveniaSolomon IslandsSouth AfricaSpainSri LankaSt. LuciaSt. Vincent and the GrenadinesSudanSurinameSwazilandSwedenSwitzerlandSyrian Arab RepublicTajikistanTanzaniaThailandTogoTongaTrinidad and TobagoTunisiaTurkeyUgandaUkraineUnited KingdomUnited StatesUruguayVanuatuVenezuela, RBVietnamYemen, Rep.ZambiaZimbabwe Timeline:
This timeline shows a graph from 1991 to 2012 of Swaziland. No data until 1990. Number of actual observations by date: 22.
Source name:
World Development Indicators
Source organization:
World Bank staff estimates based on sources and methods in World Bank's "The Changing Wealth of Nations: Measuring Sustainable Development in the New Millennium" (2011).
Categories, topics:
Economy & Growth, Environment
Last updated:
apr 23, 2017
Indicators value changes by year
Minimum:
-320.774 mln
jan 1, 2010
Maximum:
365.961 mln
jan 1, 2006
At the date of observation
Value
Absolute change
Change from previous value
jan 1, 1991
89.204 mln
+89.204 mln
0.0%
jan 1, 1992
87.581 mln
-1.623 mln
-1.82%
jan 1, 1993
90.711 mln
+3.131 mln
3.57%
jan 1, 1994
55.666 mln
-35.045 mln
-38.63%
jan 1, 1995
92.983 mln
+37.316 mln
67.04%
jan 1, 1996
79.254 mln
-13.729 mln
-14.77%
jan 1, 1997
37.249 mln
-42.004 mln
-53.0%
jan 1, 1998
94.484 mln
+57.234 mln
153.65%
jan 1, 1999
77.793 mln
-16.691 mln
-17.67%
jan 1, 2000
58.62 mln
-19.173 mln
-24.65%
jan 1, 2001
61.629 mln
+3.009 mln
5.13%
jan 1, 2002
197.633 mln
+136.004 mln
220.68%
jan 1, 2003
142.664 mln
-54.969 mln
-27.81%
jan 1, 2004
292.956 mln
+150.292 mln
105.35%
jan 1, 2005
219.739 mln
-73.217 mln
-24.99%
jan 1, 2006
365.961 mln
+146.222 mln
66.54%
jan 1, 2007
227.449 mln
-138.513 mln
-37.85%
jan 1, 2008
326.611 mln
+99.162 mln
43.6%
jan 1, 2009
-2.673 mln
-329.283 mln
-100.82%
jan 1, 2010
-320.774 mln
-318.102 mln
11.9K%
jan 1, 2011
-168.541 mln
+152.233 mln
-47.46%
jan 1, 2012
30.021 mln
+198.562 mln
-117.81%
Ranking of countries by current statistics by years


Comments: