29
/
en
AIzaSyAYiBZKx7MnpbEhh9jyipgxe19OcubqV5w
April 1, 2024
156925
Iran, Islamic Rep.
IRN
true
2
1
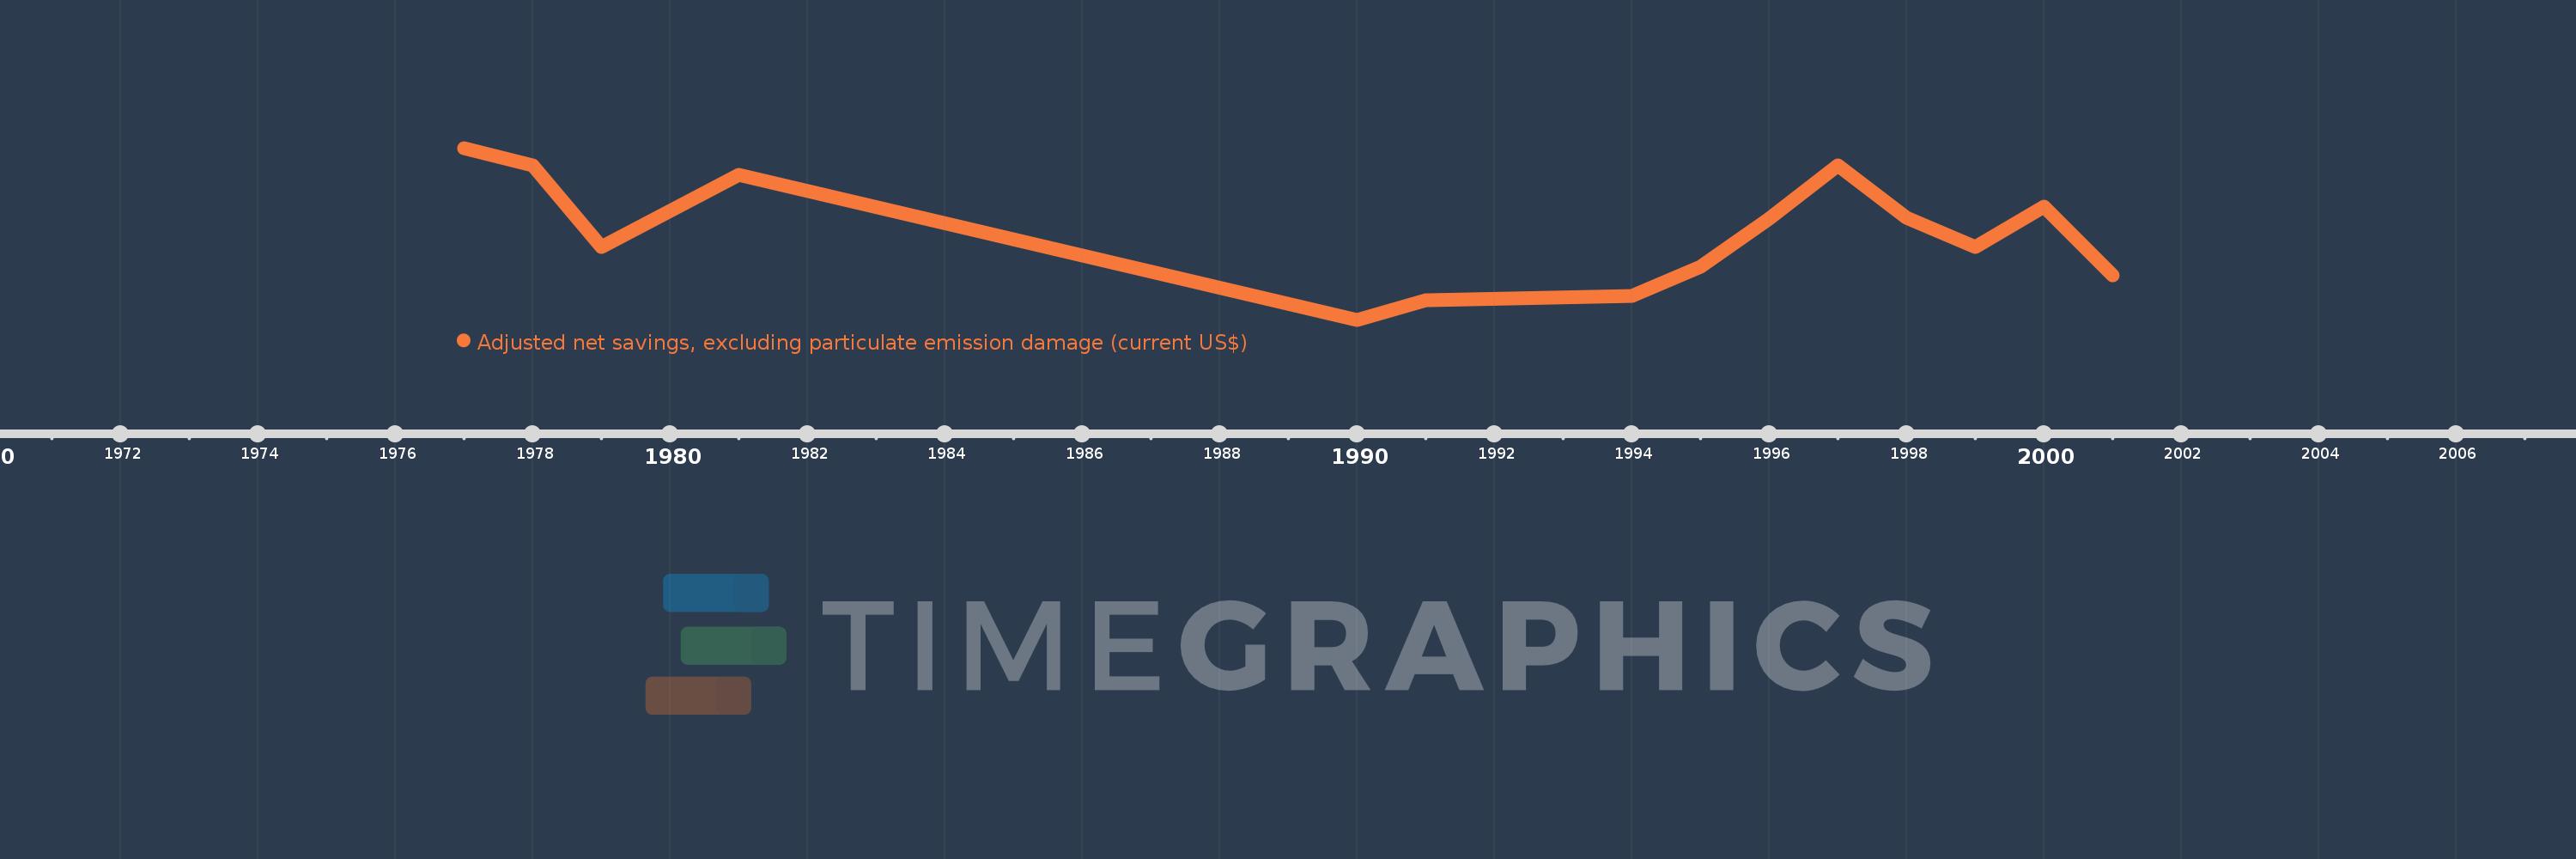
Adjusted net savings, excluding particulate emission damage (current US$)
2001,2000,1999,1998,1997,1996,1995,1994,1991,1990,1981,1980,1979,1978,1977
This statistics in other country:
AfghanistanAlbaniaAlgeriaAngolaArgentinaArmeniaAustraliaAustriaAzerbaijanBahamas, TheBahrainBangladeshBarbadosBelarusBelgiumBelizeBeninBhutanBoliviaBotswanaBrazilBrunei DarussalamBulgariaBurkina FasoBurundiCabo VerdeCambodiaCameroonCanadaCentral African RepublicChadChileChinaColombiaComorosCongo, Dem. Rep.Congo, Rep.Costa RicaCote d'IvoireCroatiaCyprusCzech RepublicDenmarkDjiboutiDominicaDominican RepublicEcuadorEgypt, Arab Rep.El SalvadorEquatorial GuineaEritreaEstoniaEthiopiaFijiFinlandFranceGabonGambia, TheGeorgiaGermanyGhanaGreeceGuatemalaGuineaGuinea-BissauGuyanaHaitiHondurasHungaryIcelandIndiaIndonesiaIran, Islamic Rep.IraqIrelandIsraelItalyJamaicaJapanJordanKazakhstanKenyaKiribatiKorea, Rep.KuwaitKyrgyz RepublicLao PDRLatviaLebanonLesothoLiberiaLibyaLithuaniaLuxembourgMacedonia, FYRMadagascarMalawiMalaysiaMaldivesMaliMauritaniaMauritiusMexicoMoldovaMongoliaMoroccoMozambiqueNamibiaNepalNetherlandsNew ZealandNicaraguaNigerNigeriaNorwayOmanPakistanPanamaPapua New GuineaParaguayPeruPhilippinesPolandPortugalQatarRomaniaRussian FederationRwandaSaudi ArabiaSenegalSeychellesSierra LeoneSingaporeSlovak RepublicSloveniaSolomon IslandsSouth AfricaSpainSri LankaSt. LuciaSt. Vincent and the GrenadinesSudanSurinameSwazilandSwedenSwitzerlandSyrian Arab RepublicTajikistanTanzaniaThailandTogoTongaTrinidad and TobagoTunisiaTurkeyUgandaUkraineUnited KingdomUnited StatesUruguayVanuatuVenezuela, RBVietnamYemen, Rep.ZambiaZimbabwe Timeline:
This timeline shows a graph from 1977 to 2001 of Iran, Islamic Rep.. No data until 1976. Number of actual observations by date: 15.
Source name:
World Development Indicators
Source organization:
World Bank staff estimates based on sources and methods in World Bank's "The Changing Wealth of Nations: Measuring Sustainable Development in the New Millennium" (2011).
Categories, topics:
Economy & Growth, Environment
Last updated:
apr 23, 2017
Indicators value changes by year
Minimum:
3.867 bln
jan 1, 1990
Maximum:
23.808 bln
jan 1, 1977
At the date of observation
Value
Absolute change
Change from previous value
jan 1, 1977
23.808 bln
+23.808 bln
0.0%
jan 1, 1978
21.771 bln
-2.037 bln
-8.55%
jan 1, 1979
12.324 bln
-9.448 bln
-43.39%
jan 1, 1980
16.545 bln
+4.221 bln
34.25%
jan 1, 1981
20.73 bln
+4.185 bln
25.29%
jan 1, 1990
3.867 bln
-16.863 bln
-81.35%
jan 1, 1991
6.166 bln
+2.3 bln
59.47%
jan 1, 1994
6.583 bln
+416.858 mln
6.76%
jan 1, 1995
10.022 bln
+3.439 bln
52.24%
jan 1, 1996
15.577 bln
+5.556 bln
55.43%
jan 1, 1997
21.745 bln
+6.167 bln
39.59%
jan 1, 1998
15.699 bln
-6.046 bln
-27.8%
jan 1, 1999
12.323 bln
-3.376 bln
-21.51%
jan 1, 2000
16.952 bln
+4.628 bln
37.56%
jan 1, 2001
9.009 bln
-7.942 bln
-46.85%
Ranking of countries by current statistics by years


Comments: