29
/
en
AIzaSyAYiBZKx7MnpbEhh9jyipgxe19OcubqV5w
April 1, 2024
82402
Belize
BLZ
true
2
1
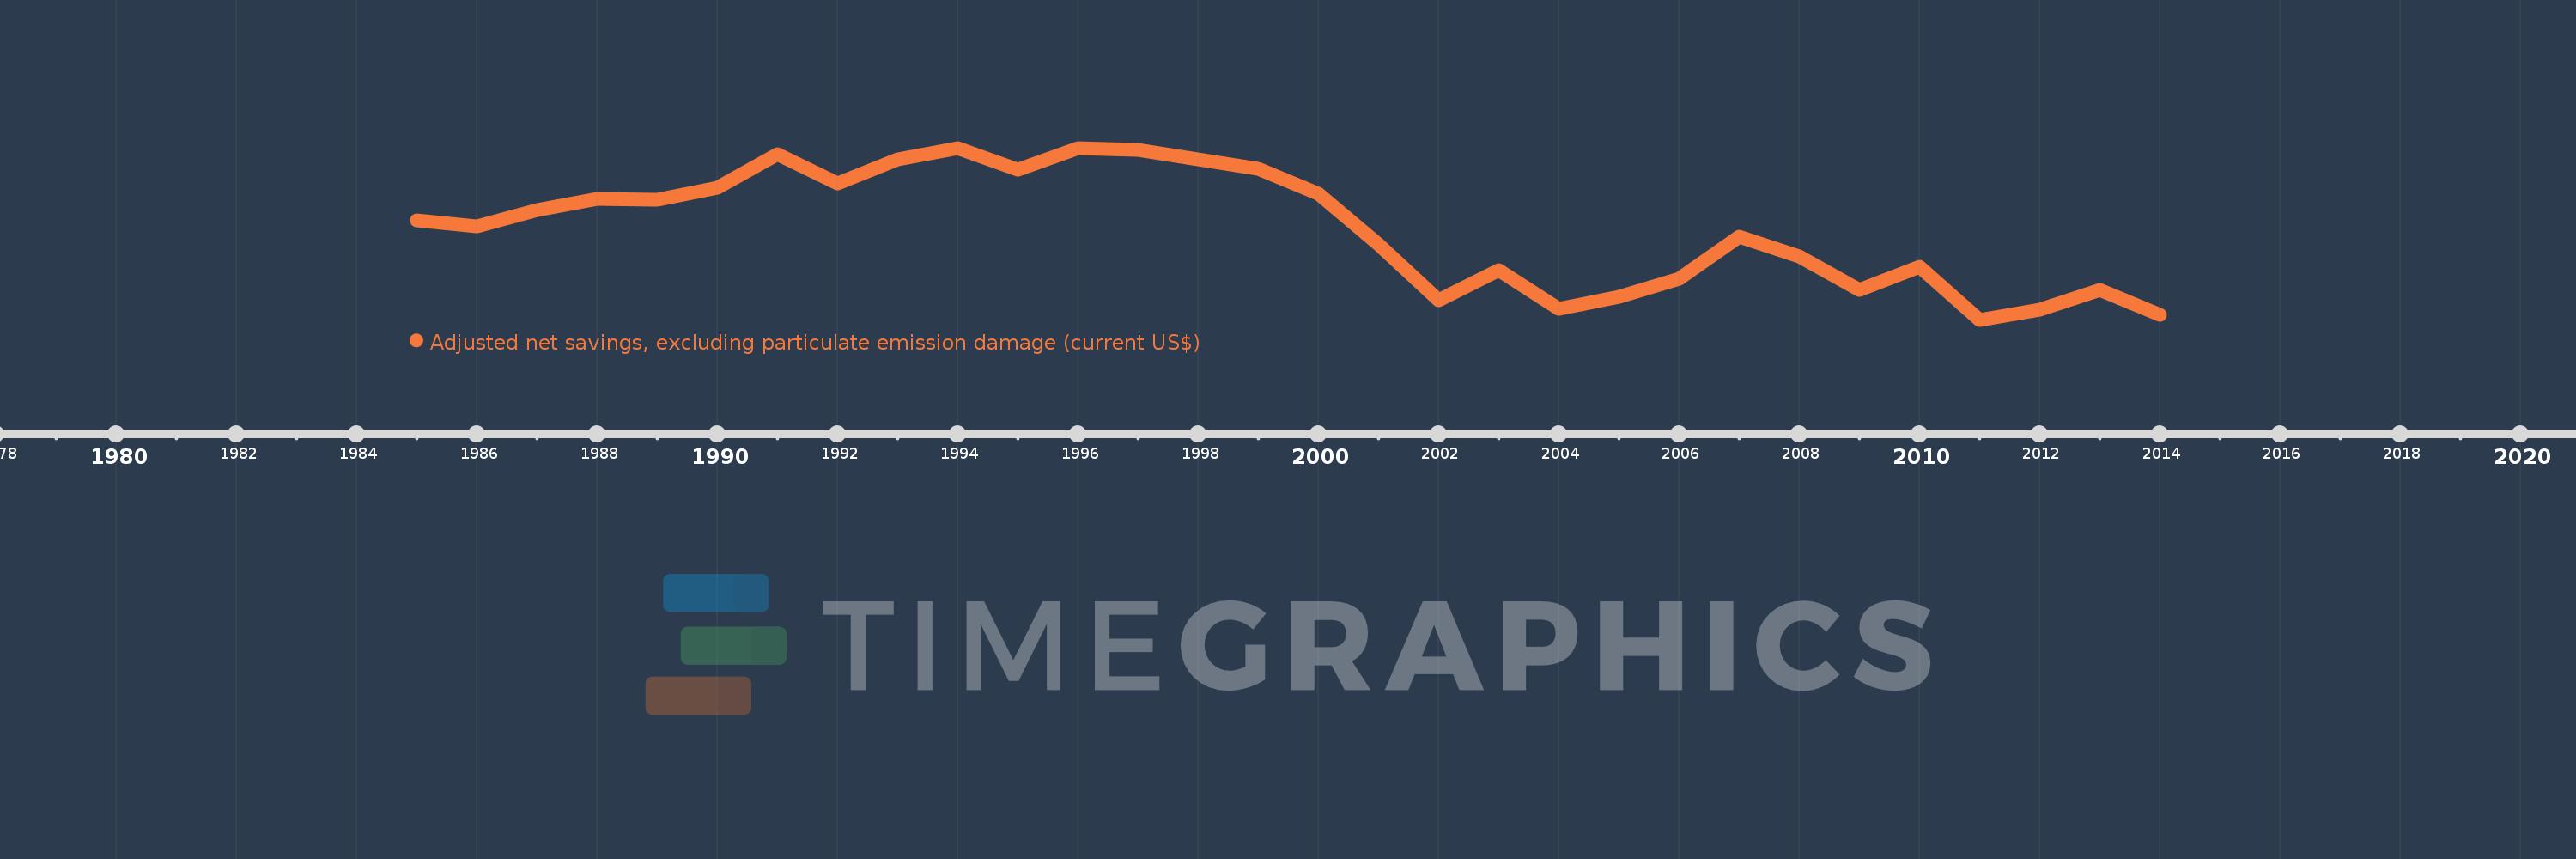
Adjusted net savings, excluding particulate emission damage (current US$)
2014,2013,2012,2011,2010,2009,2008,2007,2006,2005,2004,2003,2002,2001,2000,1999,1998,1997,1996,1995,1994,1993,1992,1991,1990,1989,1988,1987,1986,1985
This statistics in other country:
AfghanistanAlbaniaAlgeriaAngolaArgentinaArmeniaAustraliaAustriaAzerbaijanBahamas, TheBahrainBangladeshBarbadosBelarusBelgiumBelizeBeninBhutanBoliviaBotswanaBrazilBrunei DarussalamBulgariaBurkina FasoBurundiCabo VerdeCambodiaCameroonCanadaCentral African RepublicChadChileChinaColombiaComorosCongo, Dem. Rep.Congo, Rep.Costa RicaCote d'IvoireCroatiaCyprusCzech RepublicDenmarkDjiboutiDominicaDominican RepublicEcuadorEgypt, Arab Rep.El SalvadorEquatorial GuineaEritreaEstoniaEthiopiaFijiFinlandFranceGabonGambia, TheGeorgiaGermanyGhanaGreeceGuatemalaGuineaGuinea-BissauGuyanaHaitiHondurasHungaryIcelandIndiaIndonesiaIran, Islamic Rep.IraqIrelandIsraelItalyJamaicaJapanJordanKazakhstanKenyaKiribatiKorea, Rep.KuwaitKyrgyz RepublicLao PDRLatviaLebanonLesothoLiberiaLibyaLithuaniaLuxembourgMacedonia, FYRMadagascarMalawiMalaysiaMaldivesMaliMauritaniaMauritiusMexicoMoldovaMongoliaMoroccoMozambiqueNamibiaNepalNetherlandsNew ZealandNicaraguaNigerNigeriaNorwayOmanPakistanPanamaPapua New GuineaParaguayPeruPhilippinesPolandPortugalQatarRomaniaRussian FederationRwandaSaudi ArabiaSenegalSeychellesSierra LeoneSingaporeSlovak RepublicSloveniaSolomon IslandsSouth AfricaSpainSri LankaSt. LuciaSt. Vincent and the GrenadinesSudanSurinameSwazilandSwedenSwitzerlandSyrian Arab RepublicTajikistanTanzaniaThailandTogoTongaTrinidad and TobagoTunisiaTurkeyUgandaUkraineUnited KingdomUnited StatesUruguayVanuatuVenezuela, RBVietnamYemen, Rep.ZambiaZimbabwe Timeline:
This timeline shows a graph from 1985 to 2014 of Belize. No data until 1984. Number of actual observations by date: 30.
Source name:
World Development Indicators
Source organization:
World Bank staff estimates based on sources and methods in World Bank's "The Changing Wealth of Nations: Measuring Sustainable Development in the New Millennium" (2011).
Categories, topics:
Economy & Growth, Environment
Last updated:
apr 23, 2017
Indicators value changes by year
Minimum:
-87.593 mln
jan 1, 2011
Maximum:
137.449 mln
jan 1, 1996
At the date of observation
Value
Absolute change
Change from previous value
jan 1, 1985
42.588 mln
+42.588 mln
0.0%
jan 1, 1986
34.774 mln
-7.814 mln
-18.35%
jan 1, 1987
56.311 mln
+21.538 mln
61.94%
jan 1, 1988
70.724 mln
+14.413 mln
25.59%
jan 1, 1989
69.836 mln
-887.987K
-1.26%
jan 1, 1990
85.584 mln
+15.749 mln
22.55%
jan 1, 1991
129.076 mln
+43.492 mln
50.82%
jan 1, 1992
90.619 mln
-38.457 mln
-29.79%
jan 1, 1993
122.419 mln
+31.8 mln
35.09%
jan 1, 1994
137.387 mln
+14.968 mln
12.23%
jan 1, 1995
108.431 mln
-28.956 mln
-21.08%
jan 1, 1996
137.449 mln
+29.018 mln
26.76%
jan 1, 1997
134.691 mln
-2.758 mln
-2.01%
jan 1, 1998
121.939 mln
-12.752 mln
-9.47%
jan 1, 1999
109.67 mln
-12.269 mln
-10.06%
jan 1, 2000
77.186 mln
-32.484 mln
-29.62%
jan 1, 2001
11.469 mln
-65.717 mln
-85.14%
jan 1, 2002
-62.365 mln
-73.834 mln
-643.78%
jan 1, 2003
-23.133 mln
+39.232 mln
-62.91%
jan 1, 2004
-73.135 mln
-50.002 mln
216.15%
jan 1, 2005
-57.67 mln
+15.465 mln
-21.15%
jan 1, 2006
-33.944 mln
+23.726 mln
-41.14%
jan 1, 2007
20.843 mln
+54.788 mln
-161.4%
jan 1, 2008
-4.814 mln
-25.657 mln
-123.1%
jan 1, 2009
-48.447 mln
-43.633 mln
906.41%
jan 1, 2010
-18.103 mln
+30.344 mln
-62.63%
jan 1, 2011
-87.593 mln
-69.49 mln
383.85%
jan 1, 2012
-74.242 mln
+13.352 mln
-15.24%
jan 1, 2013
-48.219 mln
+26.022 mln
-35.05%
jan 1, 2014
-81.656 mln
-33.437 mln
69.34%
Ranking of countries by current statistics by years


Comments: