29
/
en
AIzaSyAYiBZKx7MnpbEhh9jyipgxe19OcubqV5w
April 1, 2024
256995
Switzerland
CHE
true
2
1
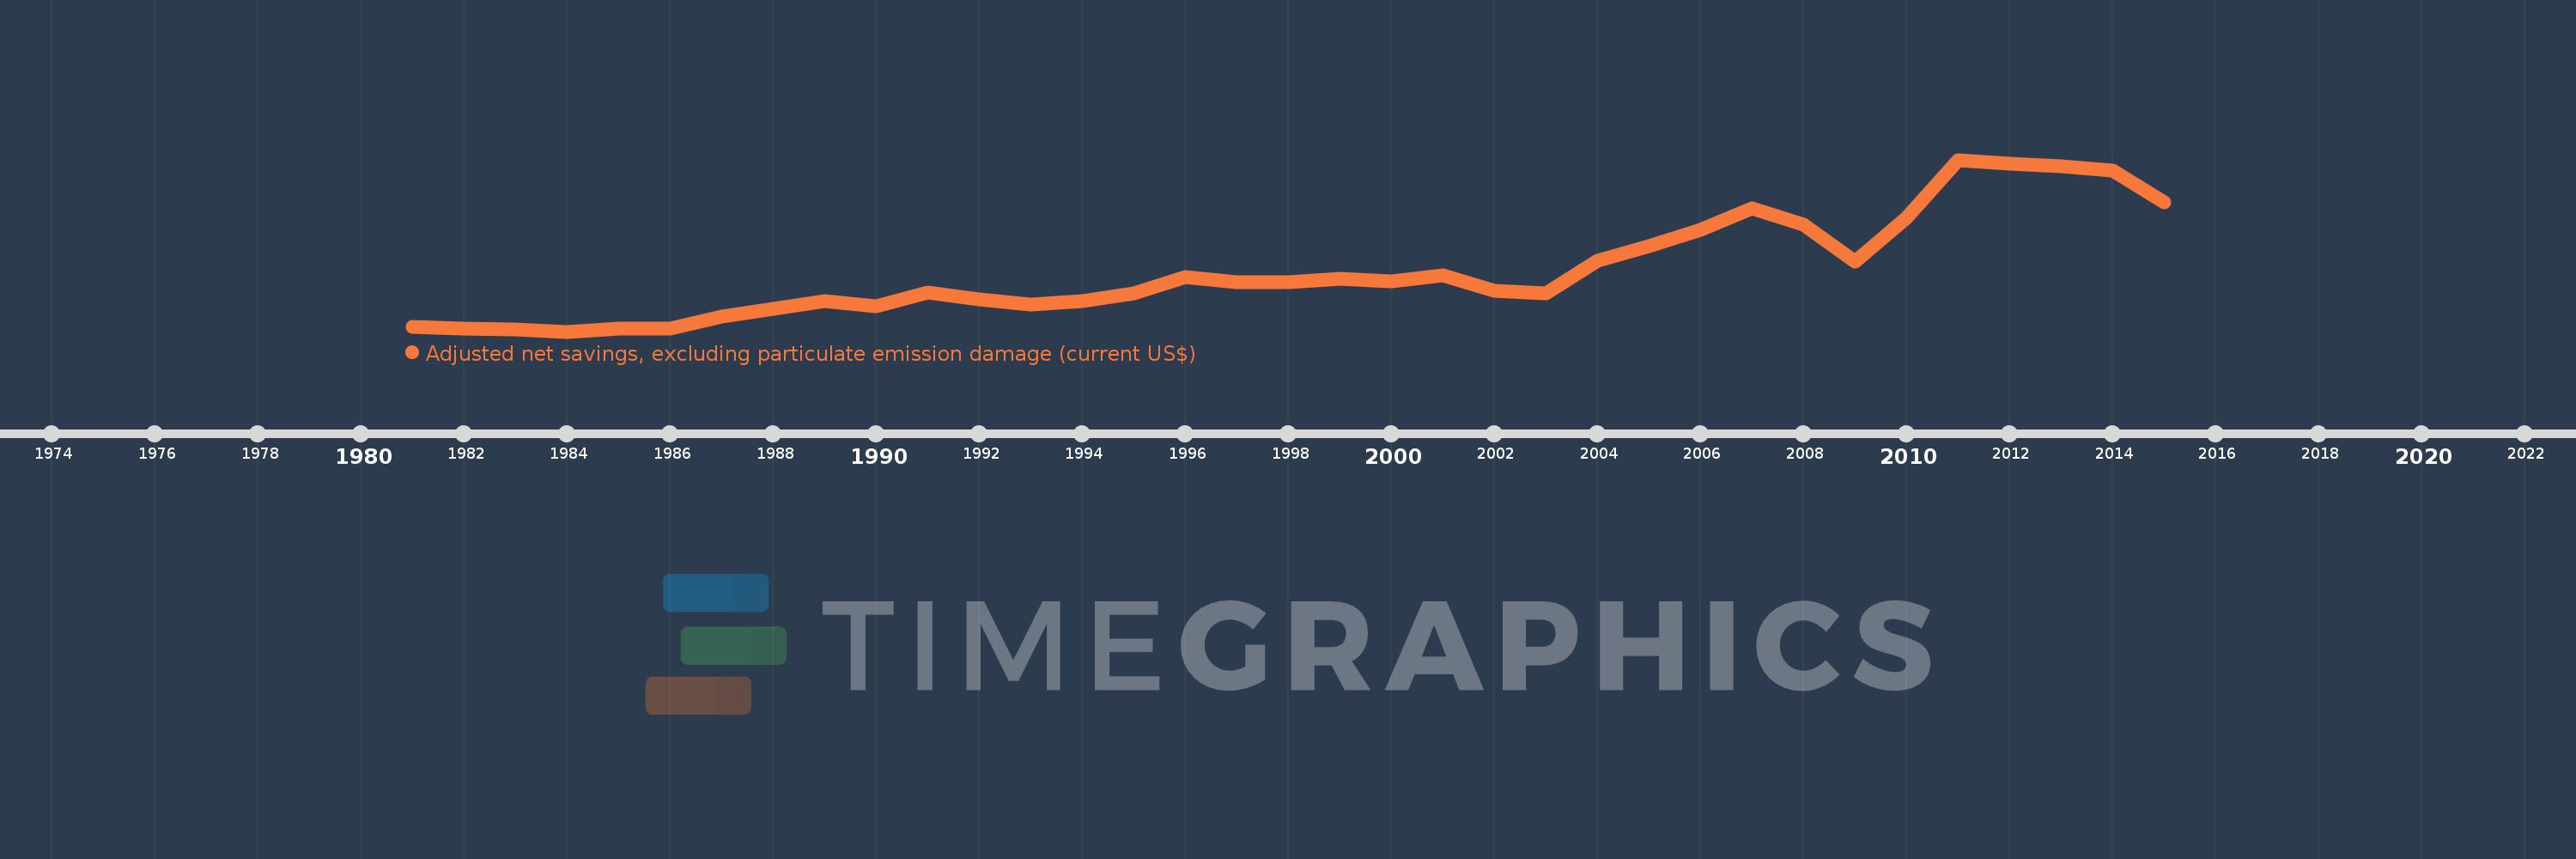
Adjusted net savings, excluding particulate emission damage (current US$)
2015,2014,2013,2012,2011,2010,2009,2008,2007,2006,2005,2004,2003,2002,2001,2000,1999,1998,1997,1996,1995,1994,1993,1992,1991,1990,1989,1988,1987,1986,1985,1984,1983,1982,1981
This statistics in other country:
AfghanistanAlbaniaAlgeriaAngolaArgentinaArmeniaAustraliaAustriaAzerbaijanBahamas, TheBahrainBangladeshBarbadosBelarusBelgiumBelizeBeninBhutanBoliviaBotswanaBrazilBrunei DarussalamBulgariaBurkina FasoBurundiCabo VerdeCambodiaCameroonCanadaCentral African RepublicChadChileChinaColombiaComorosCongo, Dem. Rep.Congo, Rep.Costa RicaCote d'IvoireCroatiaCyprusCzech RepublicDenmarkDjiboutiDominicaDominican RepublicEcuadorEgypt, Arab Rep.El SalvadorEquatorial GuineaEritreaEstoniaEthiopiaFijiFinlandFranceGabonGambia, TheGeorgiaGermanyGhanaGreeceGuatemalaGuineaGuinea-BissauGuyanaHaitiHondurasHungaryIcelandIndiaIndonesiaIran, Islamic Rep.IraqIrelandIsraelItalyJamaicaJapanJordanKazakhstanKenyaKiribatiKorea, Rep.KuwaitKyrgyz RepublicLao PDRLatviaLebanonLesothoLiberiaLibyaLithuaniaLuxembourgMacedonia, FYRMadagascarMalawiMalaysiaMaldivesMaliMauritaniaMauritiusMexicoMoldovaMongoliaMoroccoMozambiqueNamibiaNepalNetherlandsNew ZealandNicaraguaNigerNigeriaNorwayOmanPakistanPanamaPapua New GuineaParaguayPeruPhilippinesPolandPortugalQatarRomaniaRussian FederationRwandaSaudi ArabiaSenegalSeychellesSierra LeoneSingaporeSlovak RepublicSloveniaSolomon IslandsSouth AfricaSpainSri LankaSt. LuciaSt. Vincent and the GrenadinesSudanSurinameSwazilandSwedenSwitzerlandSyrian Arab RepublicTajikistanTanzaniaThailandTogoTongaTrinidad and TobagoTunisiaTurkeyUgandaUkraineUnited KingdomUnited StatesUruguayVanuatuVenezuela, RBVietnamYemen, Rep.ZambiaZimbabwe Timeline:
This timeline shows a graph from 1981 to 2015 of Switzerland. No data until 1980. Number of actual observations by date: 35.
Source name:
World Development Indicators
Source organization:
World Bank staff estimates based on sources and methods in World Bank's "The Changing Wealth of Nations: Measuring Sustainable Development in the New Millennium" (2011).
Categories, topics:
Economy & Growth, Environment
Last updated:
apr 23, 2017
Indicators value changes by year
Minimum:
18.599 bln
jan 1, 1984
Maximum:
133.865 bln
jan 1, 2011
At the date of observation
Value
Absolute change
Change from previous value
jan 1, 1981
21.665 bln
+21.665 bln
0.0%
jan 1, 1982
20.759 bln
-905.768 mln
-4.18%
jan 1, 1983
20.057 bln
-701.73 mln
-3.38%
jan 1, 1984
18.599 bln
-1.458 bln
-7.27%
jan 1, 1985
20.34 bln
+1.741 bln
9.36%
jan 1, 1986
20.432 bln
+91.83 mln
0.45%
jan 1, 1987
28.528 bln
+8.096 bln
39.62%
jan 1, 1988
33.791 bln
+5.264 bln
18.45%
jan 1, 1989
38.912 bln
+5.121 bln
15.15%
jan 1, 1990
35.695 bln
-3.217 bln
-8.27%
jan 1, 1991
44.984 bln
+9.289 bln
26.02%
jan 1, 1992
40.277 bln
-4.707 bln
-10.46%
jan 1, 1993
36.687 bln
-3.59 bln
-8.91%
jan 1, 1994
38.821 bln
+2.134 bln
5.82%
jan 1, 1995
44.416 bln
+5.595 bln
14.41%
jan 1, 1996
55.395 bln
+10.979 bln
24.72%
jan 1, 1997
52.013 bln
-3.382 bln
-6.11%
jan 1, 1998
51.827 bln
-185.74 mln
-0.36%
jan 1, 1999
53.815 bln
+1.988 bln
3.84%
jan 1, 2000
52.224 bln
-1.591 bln
-2.96%
jan 1, 2001
56.357 bln
+4.133 bln
7.91%
jan 1, 2002
45.778 bln
-10.579 bln
-18.77%
jan 1, 2003
44.519 bln
-1.259 bln
-2.75%
jan 1, 2004
66.193 bln
+21.674 bln
48.68%
jan 1, 2005
76.073 bln
+9.88 bln
14.93%
jan 1, 2006
87.117 bln
+11.045 bln
14.52%
jan 1, 2007
101.339 bln
+14.222 bln
16.33%
jan 1, 2008
90.43 bln
-10.909 bln
-10.77%
jan 1, 2009
65.431 bln
-24.999 bln
-27.64%
jan 1, 2010
95.029 bln
+29.598 bln
45.24%
jan 1, 2011
133.865 bln
+38.836 bln
40.87%
jan 1, 2012
131.433 bln
-2.432 bln
-1.82%
jan 1, 2013
129.261 bln
-2.172 bln
-1.65%
jan 1, 2014
126.572 bln
-2.688 bln
-2.08%
jan 1, 2015
105.196 bln
-21.377 bln
-16.89%
Ranking of countries by current statistics by years


Comments: