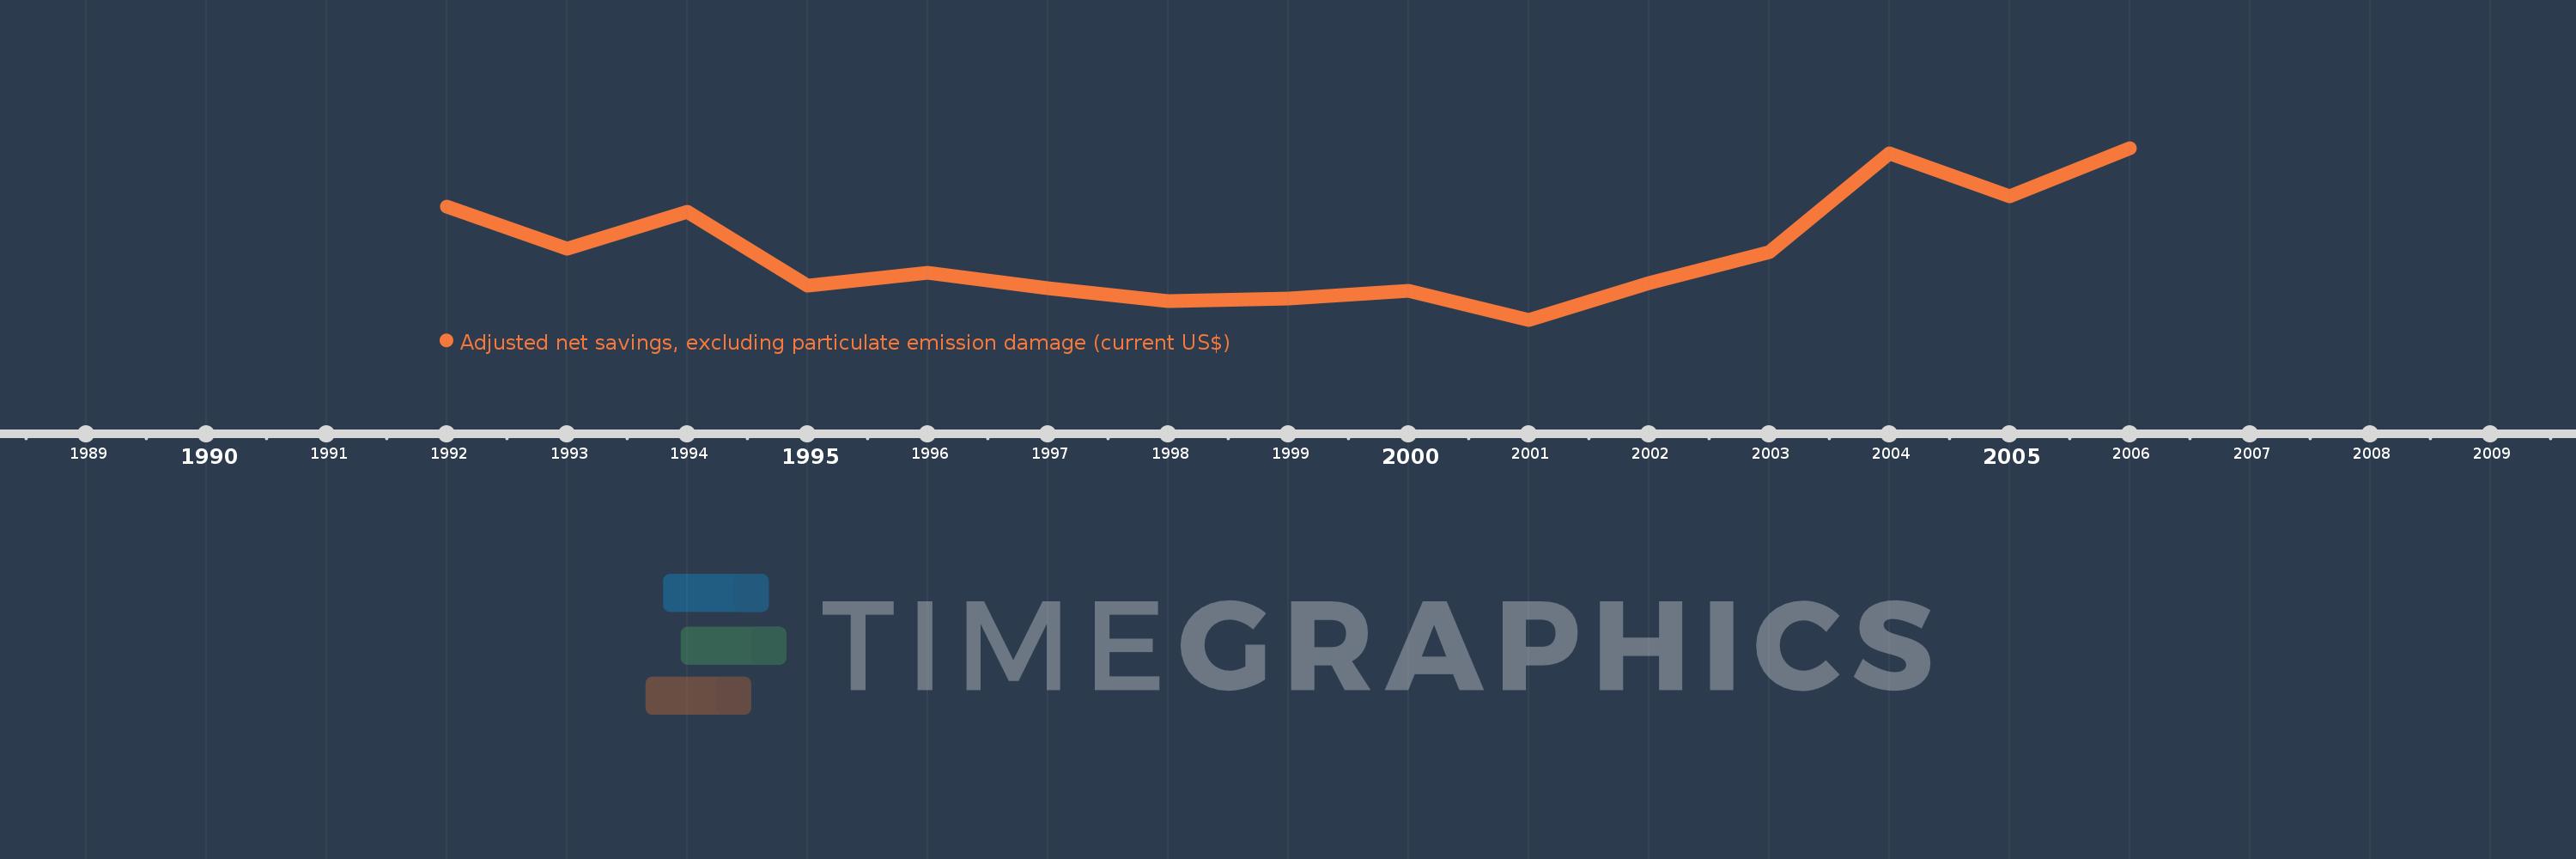
This timeline shows a graph from 1992 to 2006 of Djibouti. No data until 1991. Number of actual observations by date: 15.
Source name:
World Development Indicators
Source organization:
World Bank staff estimates based on sources and methods in World Bank's "The Changing Wealth of Nations: Measuring Sustainable Development in the New Millennium" (2011).
Categories, topics:
Economy & Growth, Environment
Last updated:
apr 23, 2017
Indicators value changes by year
Meaning:
105.427 mln
Minimum:
58.411 mln
jan 1, 2001
Maximum:
174.991 mln
jan 1, 2006
At the date of observation
Value
Absolute change
Change from the previous value
jan 1, 1992
135.347 mln
+135.347 mln
0.0%
jan 1, 1993
106.405 mln
-28.942 mln
-21.38%
jan 1, 1994
131.437 mln
+25.032 mln
23.53%
jan 1, 1995
81.511 mln
-49.926 mln
-37.98%
jan 1, 1996
90.24 mln
+8.729 mln
10.71%
jan 1, 1997
79.856 mln
-10.385 mln
-11.51%
jan 1, 1998
70.956 mln
-8.9 mln
-11.15%
jan 1, 1999
72.83 mln
+1.875 mln
2.64%
jan 1, 2000
78.253 mln
+5.422 mln
7.45%
jan 1, 2001
58.411 mln
-19.841 mln
-25.36%
jan 1, 2002
83.17 mln
+24.758 mln
42.39%
jan 1, 2003
104.339 mln
+21.169 mln
25.45%
jan 1, 2004
171.424 mln
+67.085 mln
64.3%
jan 1, 2005
142.24 mln
-29.184 mln
-17.02%
jan 1, 2006
174.991 mln
+32.751 mln
23.03%
Ranking of countries by current statistics by years
