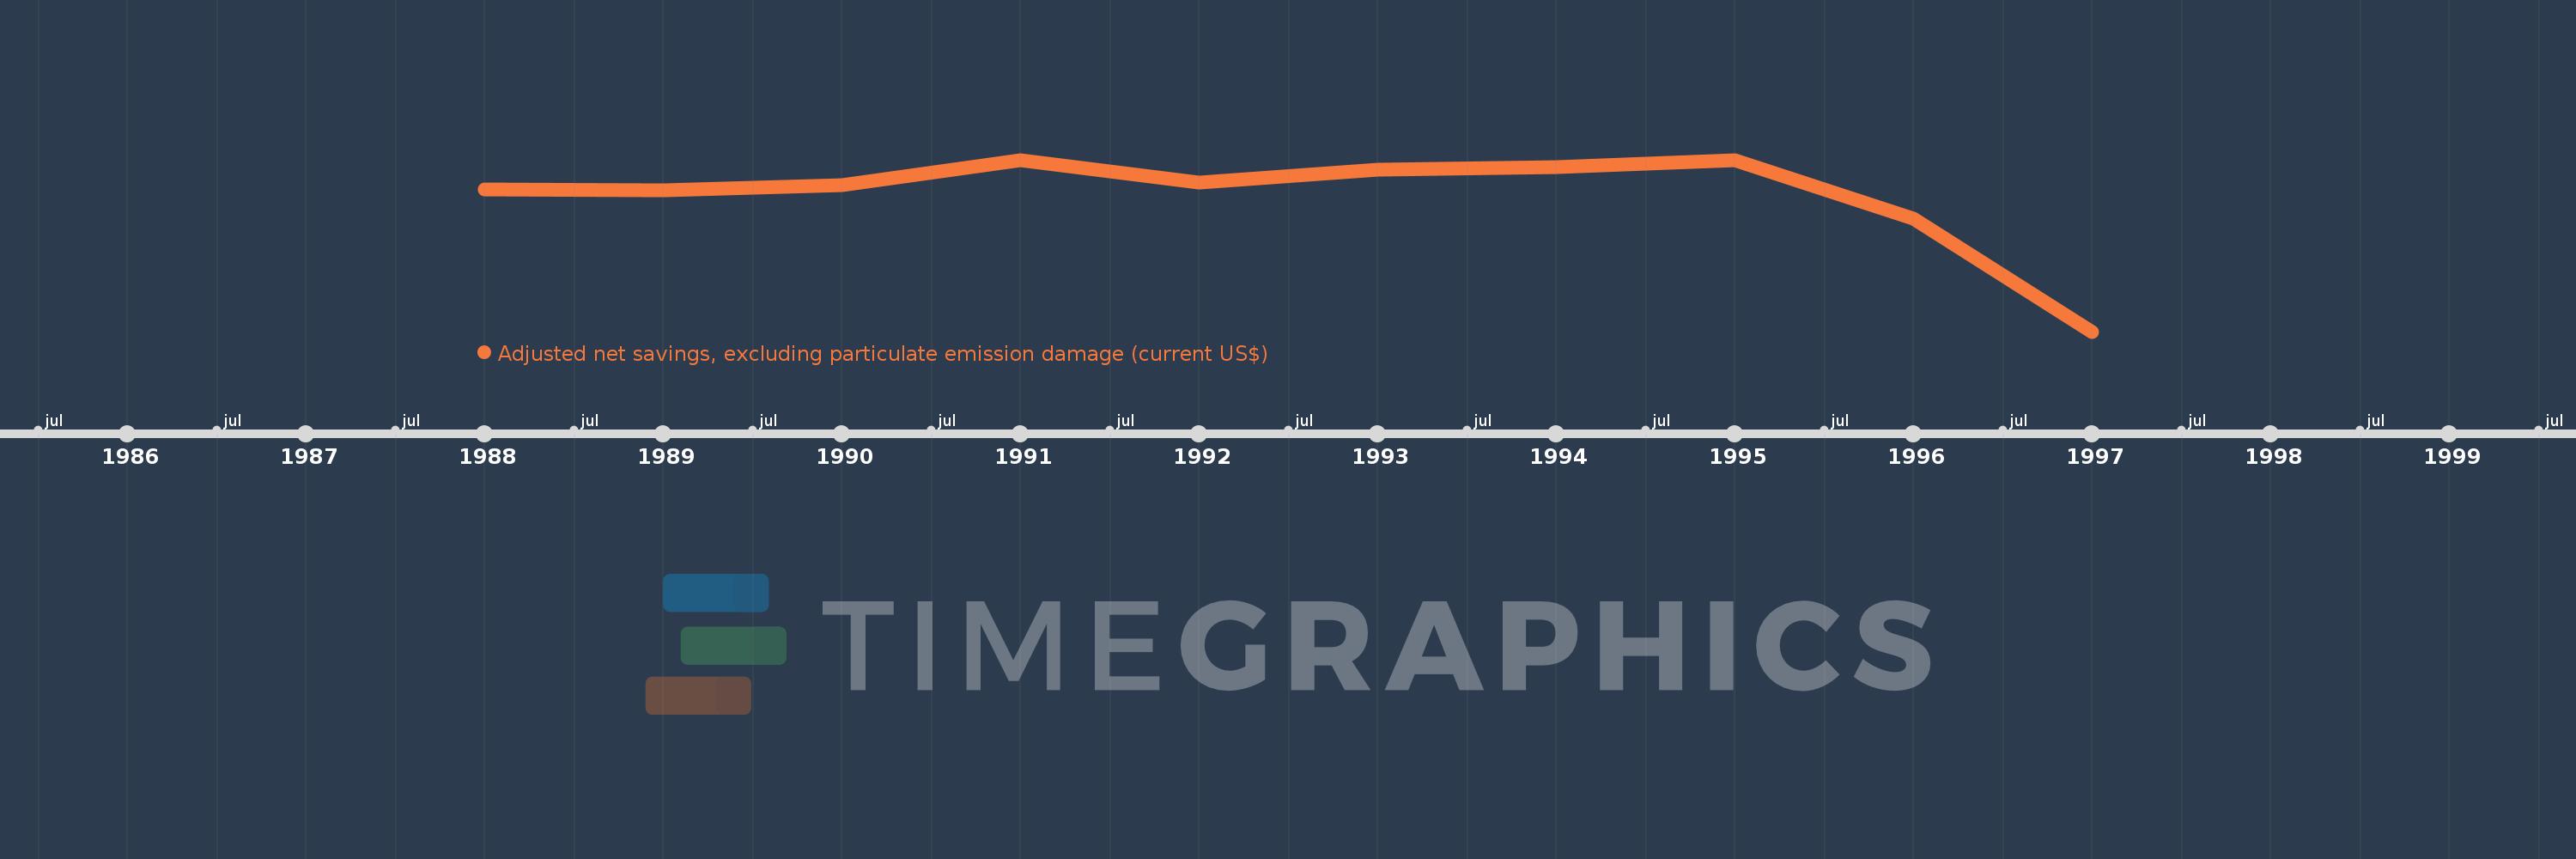
This timeline shows a graph from 1988 to 1997 of Equatorial Guinea. No data until 1987. Number of actual observations by date: 10.
Source name:
World Development Indicators
Source organization:
World Bank staff estimates based on sources and methods in World Bank's "The Changing Wealth of Nations: Measuring Sustainable Development in the New Millennium" (2011).
Categories, topics:
Economy & Growth, Environment
Last updated:
apr 23, 2017
Indicators value changes by year
Meaning:
-62.737 mln
Minimum:
-444.339 mln
jan 1, 1997
Maximum:
37.33 mln
jan 1, 1991
At the date of observation
Value
Absolute change
Change from the previous value
jan 1, 1988
-45.719 mln
-45.719 mln
0.0%
jan 1, 1989
-48.642 mln
-2.923 mln
6.39%
jan 1, 1990
-34.243 mln
+14.398 mln
-29.6%
jan 1, 1991
37.33 mln
+71.574 mln
-209.01%
jan 1, 1992
-27.043 mln
-64.373 mln
-172.44%
jan 1, 1993
10.428 mln
+37.471 mln
-138.56%
jan 1, 1994
15.924 mln
+5.496 mln
52.71%
jan 1, 1995
36.28 mln
+20.356 mln
127.83%
jan 1, 1996
-127.346 mln
-163.626 mln
-451.01%
jan 1, 1997
-444.339 mln
-316.993 mln
248.92%
Ranking of countries by current statistics by years
