29
/
en
AIzaSyAYiBZKx7MnpbEhh9jyipgxe19OcubqV5w
April 1, 2024
76818
Bahrain
BHR
true
2
1
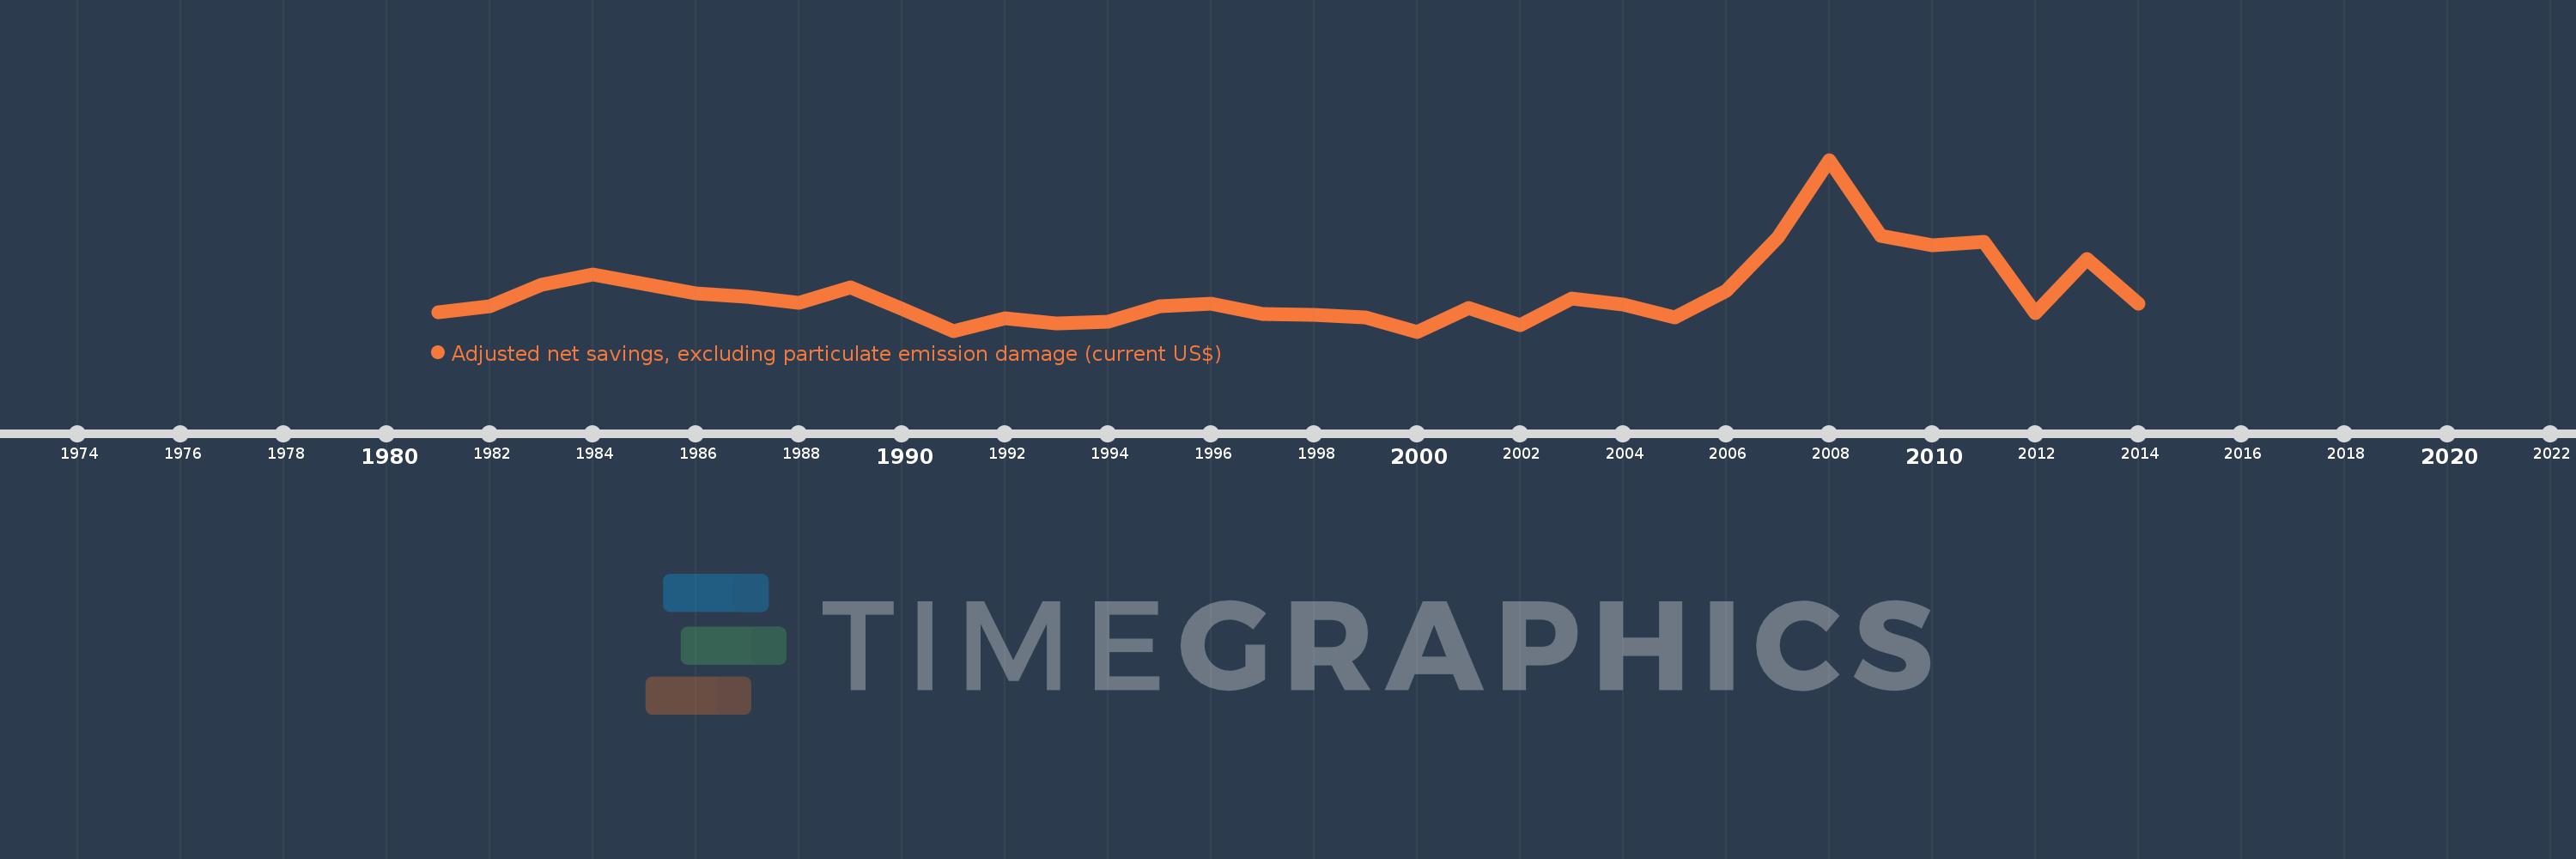
Adjusted net savings, excluding particulate emission damage (current US$)
2014,2013,2012,2011,2010,2009,2008,2007,2006,2005,2004,2003,2002,2001,2000,1999,1998,1997,1996,1995,1994,1993,1992,1991,1990,1989,1988,1987,1986,1985,1984,1983,1982,1981
This statistics in other country:
AfghanistanAlbaniaAlgeriaAngolaArgentinaArmeniaAustraliaAustriaAzerbaijanBahamas, TheBahrainBangladeshBarbadosBelarusBelgiumBelizeBeninBhutanBoliviaBotswanaBrazilBrunei DarussalamBulgariaBurkina FasoBurundiCabo VerdeCambodiaCameroonCanadaCentral African RepublicChadChileChinaColombiaComorosCongo, Dem. Rep.Congo, Rep.Costa RicaCote d'IvoireCroatiaCyprusCzech RepublicDenmarkDjiboutiDominicaDominican RepublicEcuadorEgypt, Arab Rep.El SalvadorEquatorial GuineaEritreaEstoniaEthiopiaFijiFinlandFranceGabonGambia, TheGeorgiaGermanyGhanaGreeceGuatemalaGuineaGuinea-BissauGuyanaHaitiHondurasHungaryIcelandIndiaIndonesiaIran, Islamic Rep.IraqIrelandIsraelItalyJamaicaJapanJordanKazakhstanKenyaKiribatiKorea, Rep.KuwaitKyrgyz RepublicLao PDRLatviaLebanonLesothoLiberiaLibyaLithuaniaLuxembourgMacedonia, FYRMadagascarMalawiMalaysiaMaldivesMaliMauritaniaMauritiusMexicoMoldovaMongoliaMoroccoMozambiqueNamibiaNepalNetherlandsNew ZealandNicaraguaNigerNigeriaNorwayOmanPakistanPanamaPapua New GuineaParaguayPeruPhilippinesPolandPortugalQatarRomaniaRussian FederationRwandaSaudi ArabiaSenegalSeychellesSierra LeoneSingaporeSlovak RepublicSloveniaSolomon IslandsSouth AfricaSpainSri LankaSt. LuciaSt. Vincent and the GrenadinesSudanSurinameSwazilandSwedenSwitzerlandSyrian Arab RepublicTajikistanTanzaniaThailandTogoTongaTrinidad and TobagoTunisiaTurkeyUgandaUkraineUnited KingdomUnited StatesUruguayVanuatuVenezuela, RBVietnamYemen, Rep.ZambiaZimbabwe Timeline:
This timeline shows a graph from 1981 to 2014 of Bahrain. No data until 1980. Number of actual observations by date: 34.
Source name:
World Development Indicators
Source organization:
World Bank staff estimates based on sources and methods in World Bank's "The Changing Wealth of Nations: Measuring Sustainable Development in the New Millennium" (2011).
Categories, topics:
Economy & Growth, Environment
Last updated:
apr 23, 2017
Indicators value changes by year
Minimum:
-1.231 bln
jan 1, 2000
Maximum:
3.116 bln
jan 1, 2008
At the date of observation
Value
Absolute change
Change from previous value
jan 1, 1981
-733.898 mln
-733.898 mln
0.0%
jan 1, 1982
-599.381 mln
+134.517 mln
-18.33%
jan 1, 1983
-46.586 mln
+552.795 mln
-92.23%
jan 1, 1984
224.851 mln
+271.438 mln
-582.65%
jan 1, 1985
-15.979 mln
-240.831 mln
-107.11%
jan 1, 1986
-254.85 mln
-238.871 mln
1.49K%
jan 1, 1987
-343.933 mln
-89.082 mln
34.95%
jan 1, 1988
-502.019 mln
-158.086 mln
45.96%
jan 1, 1989
-115.074 mln
+386.945 mln
-77.08%
jan 1, 1990
-646.37 mln
-531.296 mln
461.7%
jan 1, 1991
-1.218 bln
-571.838 mln
88.47%
jan 1, 1992
-893.055 mln
+325.152 mln
-26.69%
jan 1, 1993
-1.017 bln
-123.758 mln
13.86%
jan 1, 1994
-976.323 mln
+40.489 mln
-3.98%
jan 1, 1995
-585.859 mln
+390.464 mln
-39.99%
jan 1, 1996
-517.356 mln
+68.504 mln
-11.69%
jan 1, 1997
-789.483 mln
-272.128 mln
52.6%
jan 1, 1998
-805.225 mln
-15.741 mln
1.99%
jan 1, 1999
-873.651 mln
-68.427 mln
8.5%
jan 1, 2000
-1.231 bln
-357.518 mln
40.92%
jan 1, 2001
-637.886 mln
+593.284 mln
-48.19%
jan 1, 2002
-1.057 bln
-419.422 mln
65.75%
jan 1, 2003
-396.664 mln
+660.644 mln
-62.48%
jan 1, 2004
-549.804 mln
-153.139 mln
38.61%
jan 1, 2005
-882.708 mln
-332.904 mln
60.55%
jan 1, 2006
-191.183 mln
+691.525 mln
-78.34%
jan 1, 2007
1.146 bln
+1.337 bln
-699.38%
jan 1, 2008
3.116 bln
+1.97 bln
171.93%
jan 1, 2009
1.187 bln
-1.929 bln
-61.9%
jan 1, 2010
952.696 mln
-234.451 mln
-19.75%
jan 1, 2011
1.046 bln
+93.756 mln
9.84%
jan 1, 2012
-764.881 mln
-1.811 bln
-173.09%
jan 1, 2013
613.669 mln
+1.379 bln
-180.23%
jan 1, 2014
-535.536 mln
-1.149 bln
-187.27%
Ranking of countries by current statistics by years


Comments: