29
/
en
AIzaSyAYiBZKx7MnpbEhh9jyipgxe19OcubqV5w
April 1, 2024
138958
Germany
DEU
true
2
1
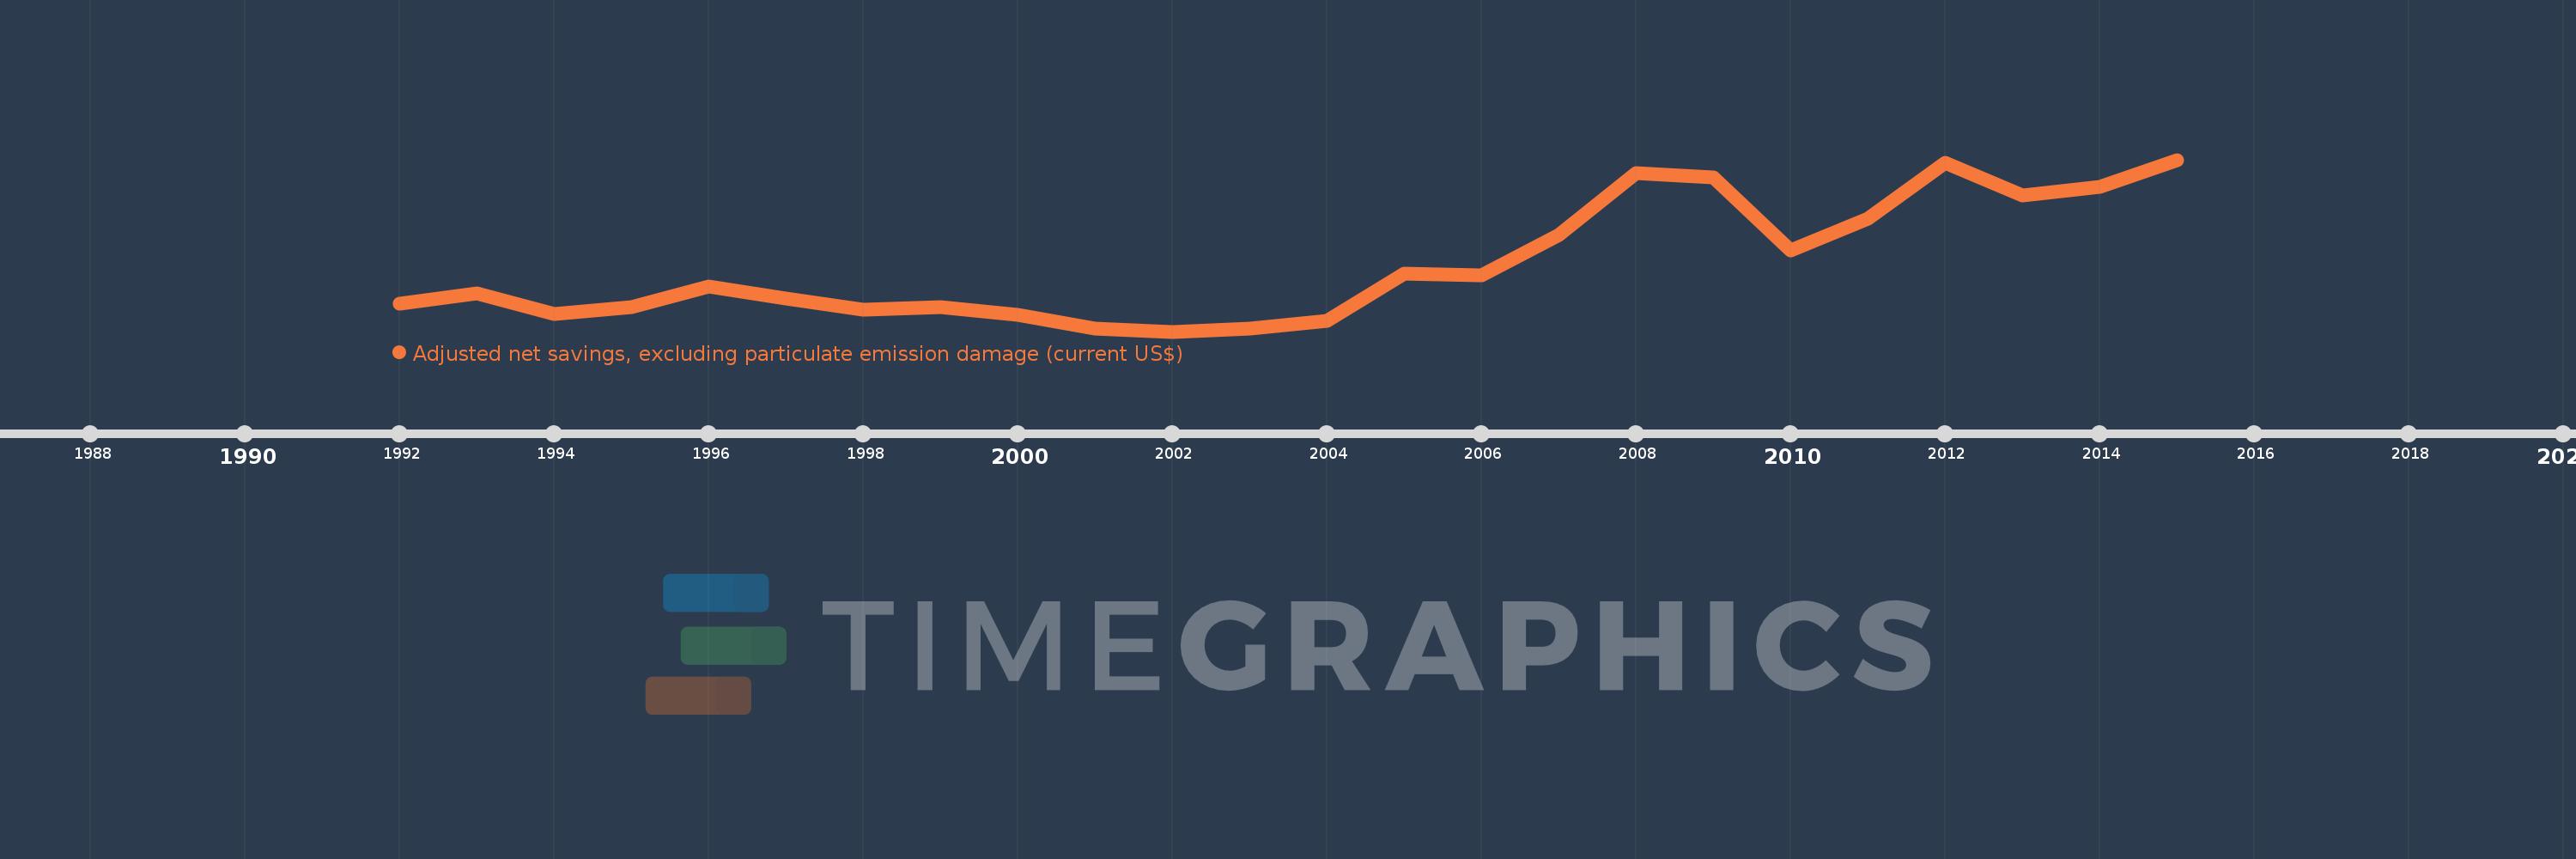
Adjusted net savings, excluding particulate emission damage (current US$)
2015,2014,2013,2012,2011,2010,2009,2008,2007,2006,2005,2004,2003,2002,2001,2000,1999,1998,1997,1996,1995,1994,1993,1992
This statistics in other country:
AfghanistanAlbaniaAlgeriaAngolaArgentinaArmeniaAustraliaAustriaAzerbaijanBahamas, TheBahrainBangladeshBarbadosBelarusBelgiumBelizeBeninBhutanBoliviaBotswanaBrazilBrunei DarussalamBulgariaBurkina FasoBurundiCabo VerdeCambodiaCameroonCanadaCentral African RepublicChadChileChinaColombiaComorosCongo, Dem. Rep.Congo, Rep.Costa RicaCote d'IvoireCroatiaCyprusCzech RepublicDenmarkDjiboutiDominicaDominican RepublicEcuadorEgypt, Arab Rep.El SalvadorEquatorial GuineaEritreaEstoniaEthiopiaFijiFinlandFranceGabonGambia, TheGeorgiaGermanyGhanaGreeceGuatemalaGuineaGuinea-BissauGuyanaHaitiHondurasHungaryIcelandIndiaIndonesiaIran, Islamic Rep.IraqIrelandIsraelItalyJamaicaJapanJordanKazakhstanKenyaKiribatiKorea, Rep.KuwaitKyrgyz RepublicLao PDRLatviaLebanonLesothoLiberiaLibyaLithuaniaLuxembourgMacedonia, FYRMadagascarMalawiMalaysiaMaldivesMaliMauritaniaMauritiusMexicoMoldovaMongoliaMoroccoMozambiqueNamibiaNepalNetherlandsNew ZealandNicaraguaNigerNigeriaNorwayOmanPakistanPanamaPapua New GuineaParaguayPeruPhilippinesPolandPortugalQatarRomaniaRussian FederationRwandaSaudi ArabiaSenegalSeychellesSierra LeoneSingaporeSlovak RepublicSloveniaSolomon IslandsSouth AfricaSpainSri LankaSt. LuciaSt. Vincent and the GrenadinesSudanSurinameSwazilandSwedenSwitzerlandSyrian Arab RepublicTajikistanTanzaniaThailandTogoTongaTrinidad and TobagoTunisiaTurkeyUgandaUkraineUnited KingdomUnited StatesUruguayVanuatuVenezuela, RBVietnamYemen, Rep.ZambiaZimbabwe Timeline:
This timeline shows a graph from 1992 to 2015 of Germany. No data until 1991. Number of actual observations by date: 24.
Source name:
World Development Indicators
Source organization:
World Bank staff estimates based on sources and methods in World Bank's "The Changing Wealth of Nations: Measuring Sustainable Development in the New Millennium" (2011).
Categories, topics:
Economy & Growth, Environment
Last updated:
apr 23, 2017
Indicators value changes by year
Minimum:
170.545 bln
jan 1, 2002
Maximum:
530.626 bln
jan 1, 2015
At the date of observation
Value
Absolute change
Change from previous value
jan 1, 1992
228.343 bln
+228.343 bln
0.0%
jan 1, 1993
250.474 bln
+22.131 bln
9.69%
jan 1, 1994
207.238 bln
-43.236 bln
-17.26%
jan 1, 1995
221.287 bln
+14.049 bln
6.78%
jan 1, 1996
264.948 bln
+43.661 bln
19.73%
jan 1, 1997
239.421 bln
-25.527 bln
-9.63%
jan 1, 1998
216.353 bln
-23.068 bln
-9.63%
jan 1, 1999
222.38 bln
+6.027 bln
2.79%
jan 1, 2000
205.983 bln
-16.398 bln
-7.37%
jan 1, 2001
176.128 bln
-29.855 bln
-14.49%
jan 1, 2002
170.545 bln
-5.583 bln
-3.17%
jan 1, 2003
176.874 bln
+6.329 bln
3.71%
jan 1, 2004
193.187 bln
+16.313 bln
9.22%
jan 1, 2005
291.36 bln
+98.173 bln
50.82%
jan 1, 2006
288.987 bln
-2.373 bln
-0.81%
jan 1, 2007
373.052 bln
+84.065 bln
29.09%
jan 1, 2008
502.127 bln
+129.075 bln
34.6%
jan 1, 2009
494.53 bln
-7.597 bln
-1.51%
jan 1, 2010
340.725 bln
-153.804 bln
-31.1%
jan 1, 2011
406.64 bln
+65.914 bln
19.35%
jan 1, 2012
524.14 bln
+117.5 bln
28.9%
jan 1, 2013
456.415 bln
-67.725 bln
-12.92%
jan 1, 2014
473.059 bln
+16.645 bln
3.65%
jan 1, 2015
530.626 bln
+57.567 bln
12.17%
Ranking of countries by current statistics by years


Comments: