29
/
en
AIzaSyAYiBZKx7MnpbEhh9jyipgxe19OcubqV5w
April 1, 2024
174985
Latvia
LVA
true
2
1
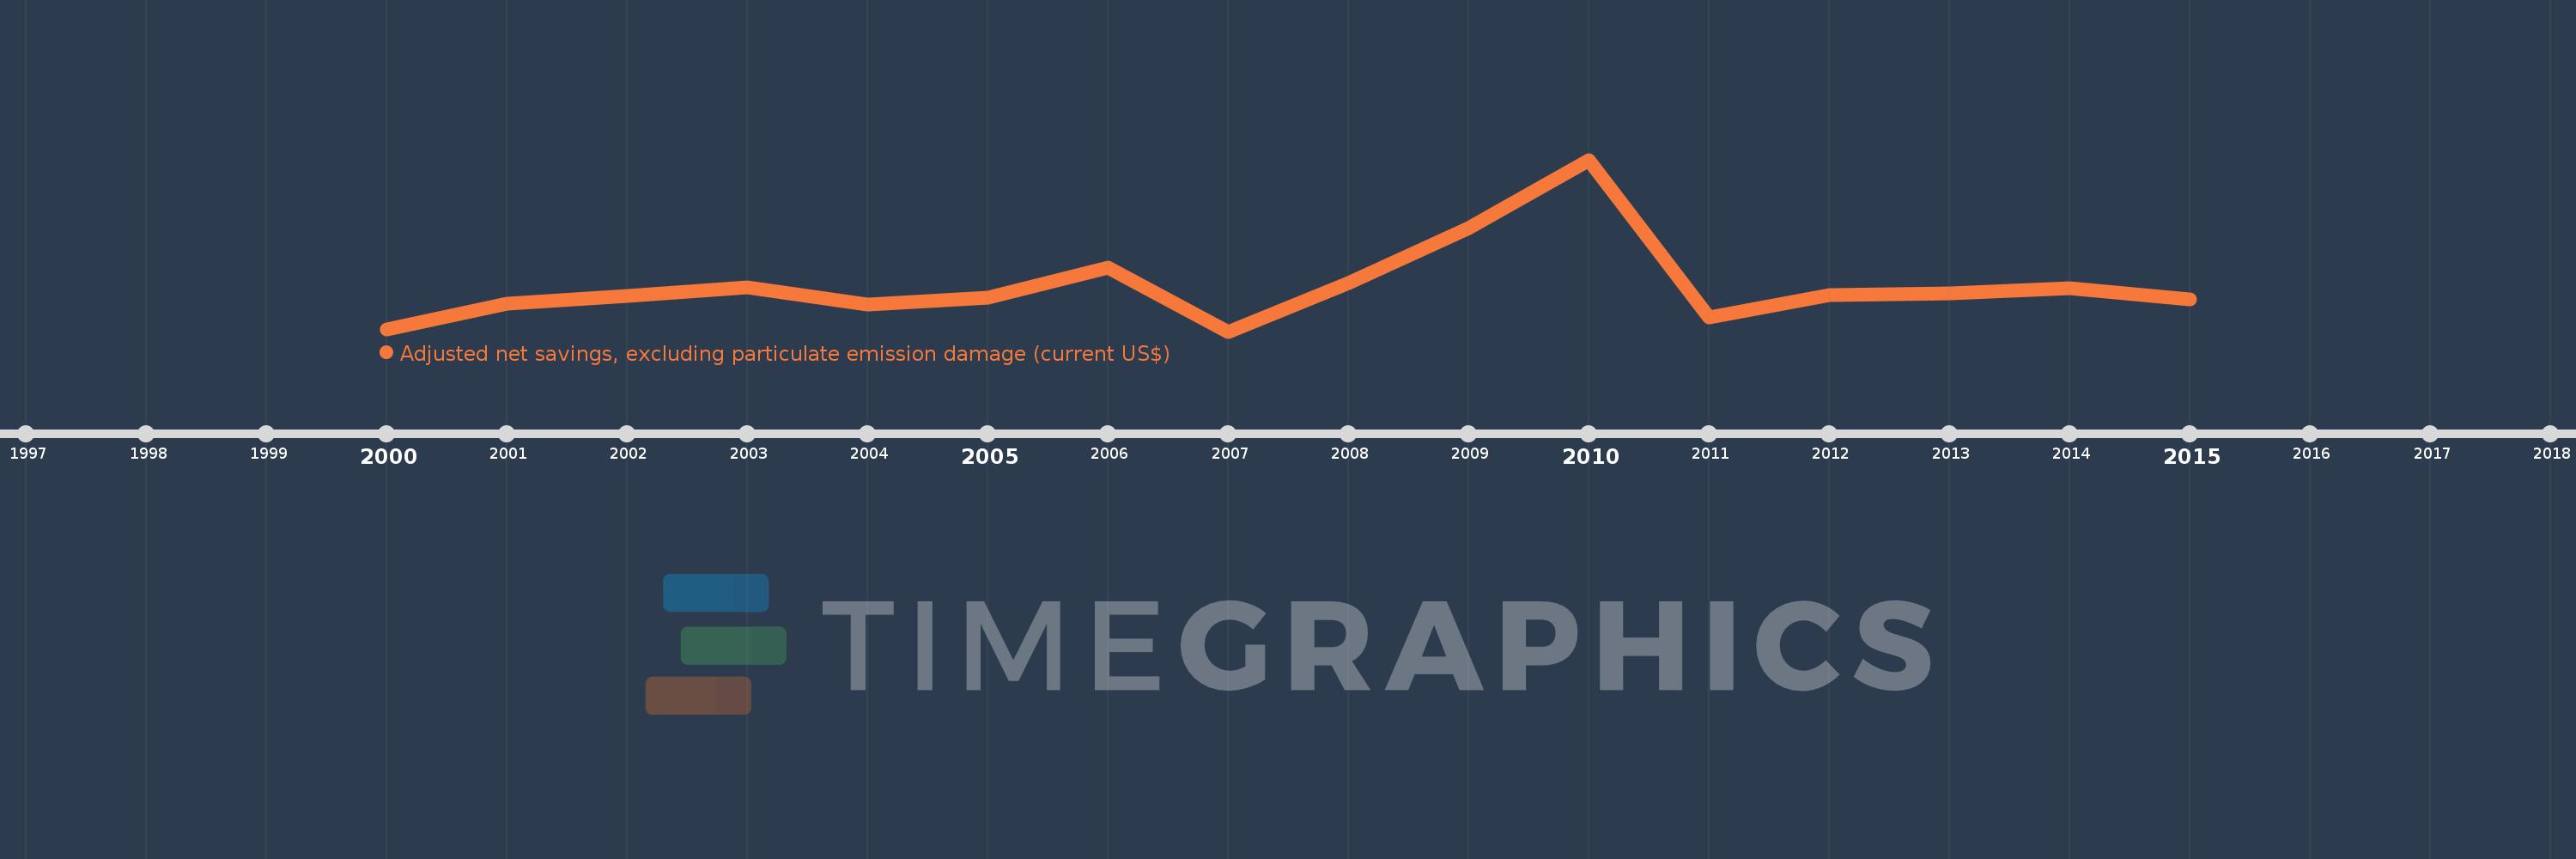
Adjusted net savings, excluding particulate emission damage (current US$)
2015,2014,2013,2012,2011,2010,2009,2008,2007,2006,2005,2004,2003,2002,2001,2000
This statistics in other country:
AfghanistanAlbaniaAlgeriaAngolaArgentinaArmeniaAustraliaAustriaAzerbaijanBahamas, TheBahrainBangladeshBarbadosBelarusBelgiumBelizeBeninBhutanBoliviaBotswanaBrazilBrunei DarussalamBulgariaBurkina FasoBurundiCabo VerdeCambodiaCameroonCanadaCentral African RepublicChadChileChinaColombiaComorosCongo, Dem. Rep.Congo, Rep.Costa RicaCote d'IvoireCroatiaCyprusCzech RepublicDenmarkDjiboutiDominicaDominican RepublicEcuadorEgypt, Arab Rep.El SalvadorEquatorial GuineaEritreaEstoniaEthiopiaFijiFinlandFranceGabonGambia, TheGeorgiaGermanyGhanaGreeceGuatemalaGuineaGuinea-BissauGuyanaHaitiHondurasHungaryIcelandIndiaIndonesiaIran, Islamic Rep.IraqIrelandIsraelItalyJamaicaJapanJordanKazakhstanKenyaKiribatiKorea, Rep.KuwaitKyrgyz RepublicLao PDRLatviaLebanonLesothoLiberiaLibyaLithuaniaLuxembourgMacedonia, FYRMadagascarMalawiMalaysiaMaldivesMaliMauritaniaMauritiusMexicoMoldovaMongoliaMoroccoMozambiqueNamibiaNepalNetherlandsNew ZealandNicaraguaNigerNigeriaNorwayOmanPakistanPanamaPapua New GuineaParaguayPeruPhilippinesPolandPortugalQatarRomaniaRussian FederationRwandaSaudi ArabiaSenegalSeychellesSierra LeoneSingaporeSlovak RepublicSloveniaSolomon IslandsSouth AfricaSpainSri LankaSt. LuciaSt. Vincent and the GrenadinesSudanSurinameSwazilandSwedenSwitzerlandSyrian Arab RepublicTajikistanTanzaniaThailandTogoTongaTrinidad and TobagoTunisiaTurkeyUgandaUkraineUnited KingdomUnited StatesUruguayVanuatuVenezuela, RBVietnamYemen, Rep.ZambiaZimbabwe Timeline:
This timeline shows a graph from 2000 to 2015 of Latvia. No data until 1999. Number of actual observations by date: 16.
Source name:
World Development Indicators
Source organization:
World Bank staff estimates based on sources and methods in World Bank's "The Changing Wealth of Nations: Measuring Sustainable Development in the New Millennium" (2011).
Categories, topics:
Economy & Growth, Environment
Last updated:
apr 23, 2017
Indicators value changes by year
Minimum:
-406.227 mln
jan 1, 2007
Maximum:
2.566 bln
jan 1, 2010
At the date of observation
Value
Absolute change
Change from previous value
jan 1, 2000
-368.717 mln
-368.717 mln
0.0%
jan 1, 2001
75.302 mln
+444.019 mln
-120.42%
jan 1, 2002
215.353 mln
+140.051 mln
185.98%
jan 1, 2003
362.789 mln
+147.436 mln
68.46%
jan 1, 2004
61.178 mln
-301.611 mln
-83.14%
jan 1, 2005
182.461 mln
+121.283 mln
198.25%
jan 1, 2006
701.295 mln
+518.834 mln
284.35%
jan 1, 2007
-406.227 mln
-1.108 bln
-157.93%
jan 1, 2008
430.83 mln
+837.057 mln
-206.06%
jan 1, 2009
1.38 bln
+949.648 mln
220.42%
jan 1, 2010
2.566 bln
+1.185 bln
85.85%
jan 1, 2011
-154.697 mln
-2.72 bln
-106.03%
jan 1, 2012
222.752 mln
+377.449 mln
-243.99%
jan 1, 2013
261.803 mln
+39.051 mln
17.53%
jan 1, 2014
344.726 mln
+82.923 mln
31.67%
jan 1, 2015
156.27 mln
-188.456 mln
-54.67%
Ranking of countries by current statistics by years


Comments: