29
/
en
AIzaSyAYiBZKx7MnpbEhh9jyipgxe19OcubqV5w
April 1, 2024
94442
Burkina Faso
BFA
true
2
1
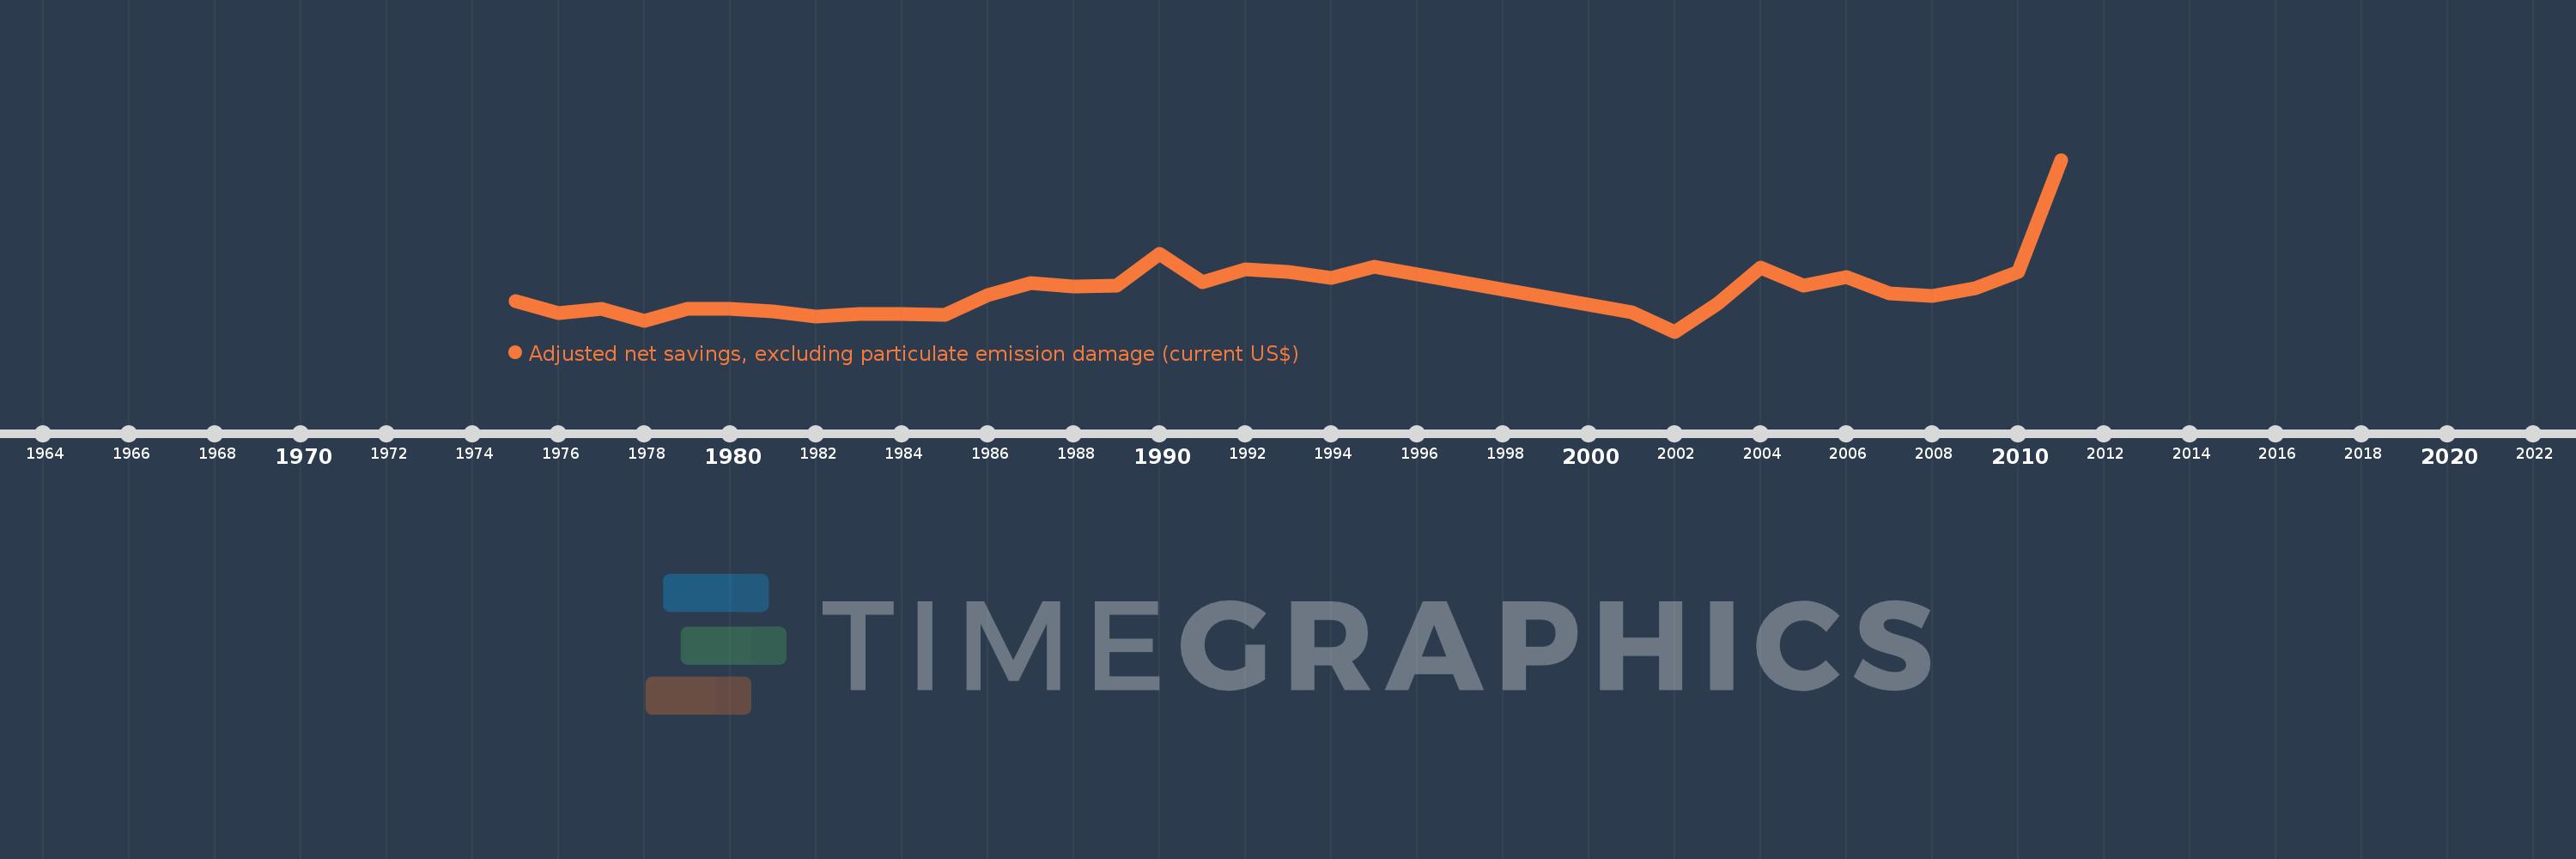
Adjusted net savings, excluding particulate emission damage (current US$)
2011,2010,2009,2008,2007,2006,2005,2004,2003,2002,2001,1995,1994,1993,1992,1991,1990,1989,1988,1987,1986,1985,1984,1983,1982,1981,1980,1979,1978,1977,1976,1975
This statistics in other country:
AfghanistanAlbaniaAlgeriaAngolaArgentinaArmeniaAustraliaAustriaAzerbaijanBahamas, TheBahrainBangladeshBarbadosBelarusBelgiumBelizeBeninBhutanBoliviaBotswanaBrazilBrunei DarussalamBulgariaBurkina FasoBurundiCabo VerdeCambodiaCameroonCanadaCentral African RepublicChadChileChinaColombiaComorosCongo, Dem. Rep.Congo, Rep.Costa RicaCote d'IvoireCroatiaCyprusCzech RepublicDenmarkDjiboutiDominicaDominican RepublicEcuadorEgypt, Arab Rep.El SalvadorEquatorial GuineaEritreaEstoniaEthiopiaFijiFinlandFranceGabonGambia, TheGeorgiaGermanyGhanaGreeceGuatemalaGuineaGuinea-BissauGuyanaHaitiHondurasHungaryIcelandIndiaIndonesiaIran, Islamic Rep.IraqIrelandIsraelItalyJamaicaJapanJordanKazakhstanKenyaKiribatiKorea, Rep.KuwaitKyrgyz RepublicLao PDRLatviaLebanonLesothoLiberiaLibyaLithuaniaLuxembourgMacedonia, FYRMadagascarMalawiMalaysiaMaldivesMaliMauritaniaMauritiusMexicoMoldovaMongoliaMoroccoMozambiqueNamibiaNepalNetherlandsNew ZealandNicaraguaNigerNigeriaNorwayOmanPakistanPanamaPapua New GuineaParaguayPeruPhilippinesPolandPortugalQatarRomaniaRussian FederationRwandaSaudi ArabiaSenegalSeychellesSierra LeoneSingaporeSlovak RepublicSloveniaSolomon IslandsSouth AfricaSpainSri LankaSt. LuciaSt. Vincent and the GrenadinesSudanSurinameSwazilandSwedenSwitzerlandSyrian Arab RepublicTajikistanTanzaniaThailandTogoTongaTrinidad and TobagoTunisiaTurkeyUgandaUkraineUnited KingdomUnited StatesUruguayVanuatuVenezuela, RBVietnamYemen, Rep.ZambiaZimbabwe Timeline:
This timeline shows a graph from 1975 to 2011 of Burkina Faso. No data until 1974. Number of actual observations by date: 32.
Source name:
World Development Indicators
Source organization:
World Bank staff estimates based on sources and methods in World Bank's "The Changing Wealth of Nations: Measuring Sustainable Development in the New Millennium" (2011).
Categories, topics:
Economy & Growth, Environment
Last updated:
apr 23, 2017
Indicators value changes by year
Minimum:
-19.253 mln
jan 1, 2002
Maximum:
1.04 bln
jan 1, 2011
At the date of observation
Value
Absolute change
Change from previous value
jan 1, 1975
167.438 mln
+167.438 mln
0.0%
jan 1, 1976
93.901 mln
-73.537 mln
-43.92%
jan 1, 1977
120.639 mln
+26.738 mln
28.48%
jan 1, 1978
47.569 mln
-73.07 mln
-60.57%
jan 1, 1979
120.407 mln
+72.838 mln
153.12%
jan 1, 1980
123.443 mln
+3.037 mln
2.52%
jan 1, 1981
104.06 mln
-19.383 mln
-15.7%
jan 1, 1982
74.818 mln
-29.242 mln
-28.1%
jan 1, 1983
91.588 mln
+16.77 mln
22.41%
jan 1, 1984
89.476 mln
-2.112 mln
-2.31%
jan 1, 1985
86.515 mln
-2.96 mln
-3.31%
jan 1, 1986
203.631 mln
+117.115 mln
135.37%
jan 1, 1987
278.524 mln
+74.893 mln
36.78%
jan 1, 1988
258.658 mln
-19.866 mln
-7.13%
jan 1, 1989
263.736 mln
+5.078 mln
1.96%
jan 1, 1990
460.764 mln
+197.029 mln
74.71%
jan 1, 1991
284.685 mln
-176.079 mln
-38.21%
jan 1, 1992
364.456 mln
+79.771 mln
28.02%
jan 1, 1993
349.954 mln
-14.502 mln
-3.98%
jan 1, 1994
312.961 mln
-36.994 mln
-10.57%
jan 1, 1995
381.425 mln
+68.464 mln
21.88%
jan 1, 2001
100.928 mln
-280.497 mln
-73.54%
jan 1, 2002
-19.253 mln
-120.181 mln
-119.08%
jan 1, 2003
154.237 mln
+173.49 mln
-901.11%
jan 1, 2004
374.874 mln
+220.637 mln
143.05%
jan 1, 2005
266.473 mln
-108.401 mln
-28.92%
jan 1, 2006
314.606 mln
+48.133 mln
18.06%
jan 1, 2007
216.937 mln
-97.668 mln
-31.04%
jan 1, 2008
201.024 mln
-15.914 mln
-7.34%
jan 1, 2009
250.135 mln
+49.112 mln
24.43%
jan 1, 2010
347.829 mln
+97.694 mln
39.06%
jan 1, 2011
1.04 bln
+692.25 mln
199.02%
Ranking of countries by current statistics by years


Comments: