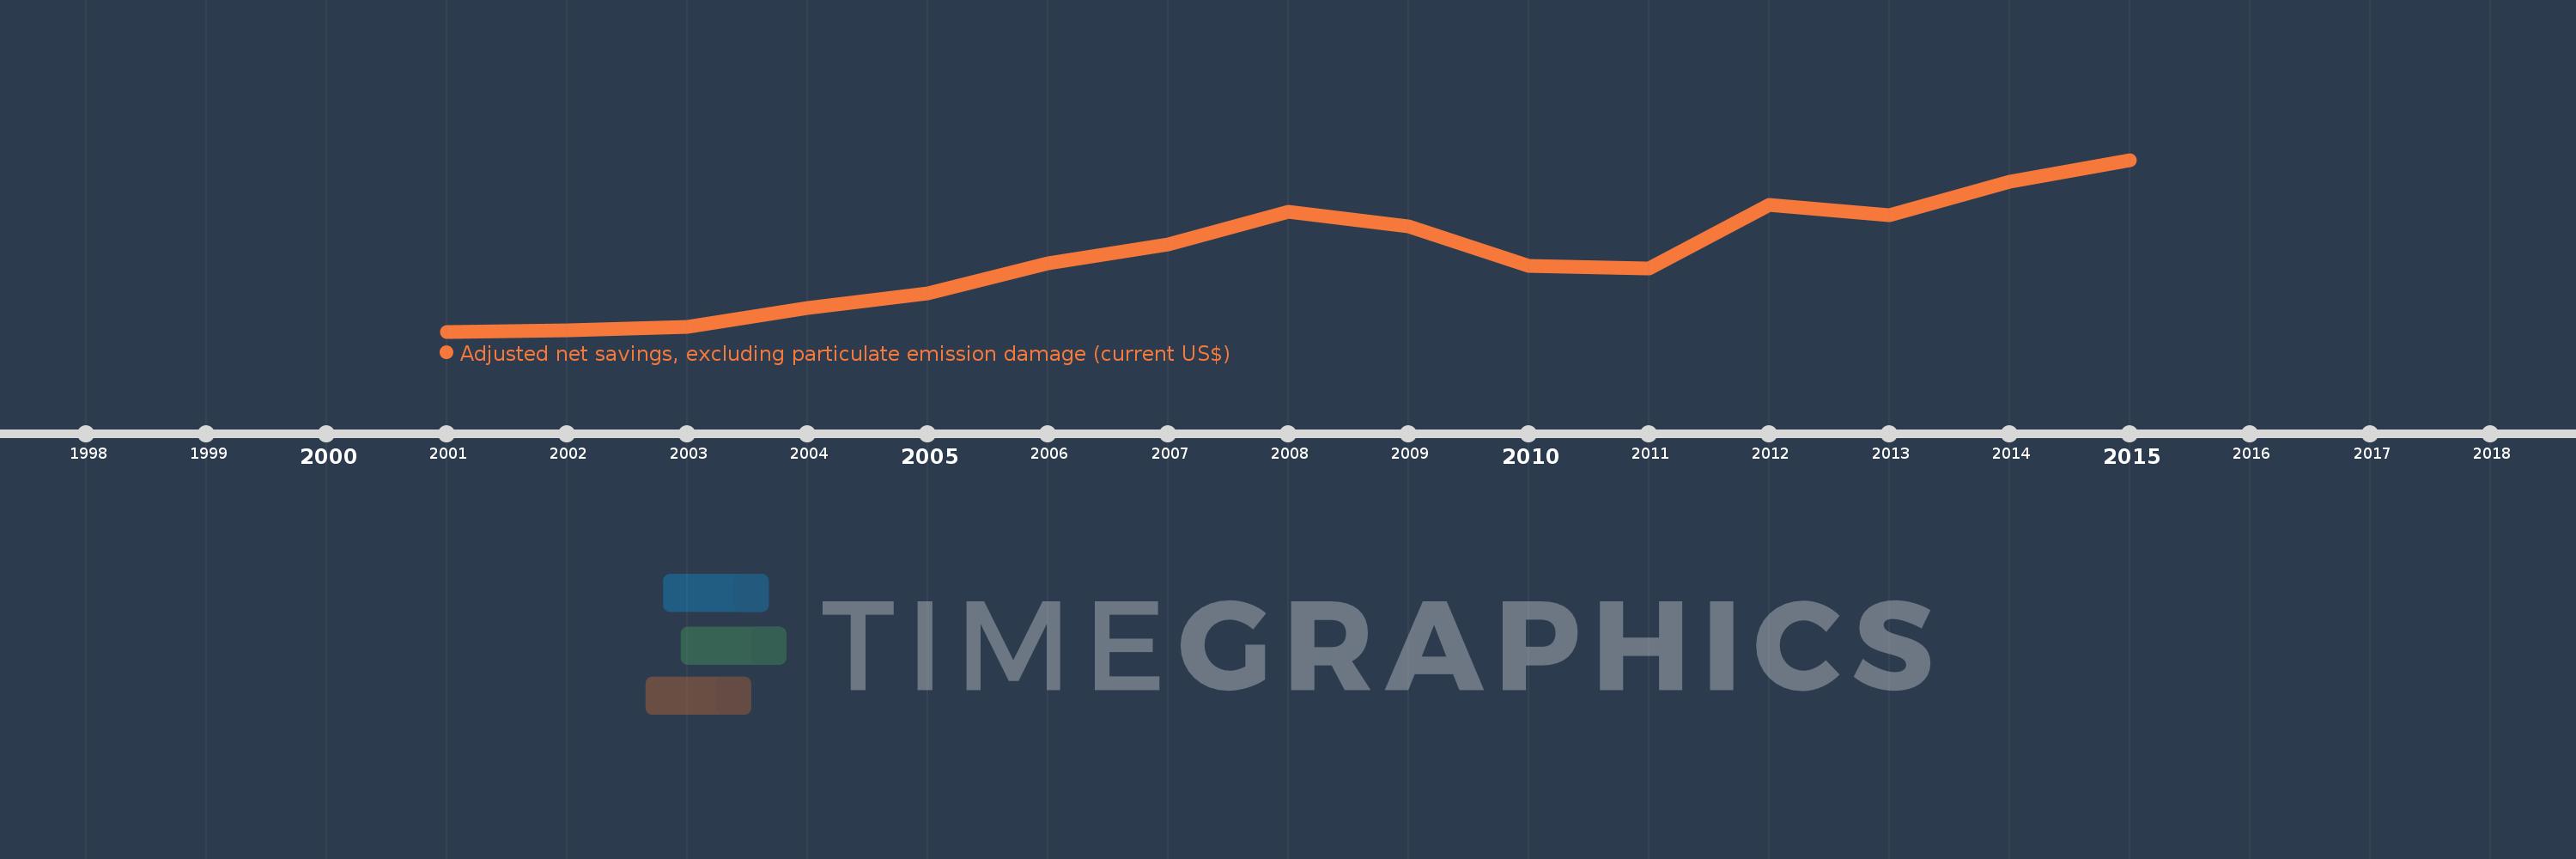
This timeline shows a graph from 2001 to 2015 of Estonia. No data until 2000. Number of actual observations by date: 15.
Source name:
World Development Indicators
Source organization:
World Bank staff estimates based on sources and methods in World Bank's "The Changing Wealth of Nations: Measuring Sustainable Development in the New Millennium" (2011).
Categories, topics:
Economy & Growth, Environment
Last updated:
apr 23, 2017
Indicators value changes by year
Meaning:
2.298 bln
Minimum:
697.847 mln
jan 1, 2001
Maximum:
4.309 bln
jan 1, 2015
At the date of observation
Value
Absolute change
Change from the previous value
jan 1, 2001
697.847 mln
+697.847 mln
0.0%
jan 1, 2002
724.748 mln
+26.901 mln
3.85%
jan 1, 2003
791.763 mln
+67.015 mln
9.25%
jan 1, 2004
1.199 bln
+407.708 mln
51.49%
jan 1, 2005
1.499 bln
+299.189 mln
24.94%
jan 1, 2006
2.125 bln
+626.043 mln
41.77%
jan 1, 2007
2.537 bln
+412.465 mln
19.41%
jan 1, 2008
3.213 bln
+676.079 mln
26.65%
jan 1, 2009
2.903 bln
-310.636 mln
-9.67%
jan 1, 2010
2.083 bln
-819.441 mln
-28.23%
jan 1, 2011
2.021 bln
-62.541 mln
-3.0%
jan 1, 2012
3.369 bln
+1.349 bln
66.75%
jan 1, 2013
3.153 bln
-216.357 mln
-6.42%
jan 1, 2014
3.842 bln
+689.327 mln
21.86%
jan 1, 2015
4.309 bln
+466.967 mln
12.15%
Ranking of countries by current statistics by years
