29
/
en
AIzaSyAYiBZKx7MnpbEhh9jyipgxe19OcubqV5w
April 1, 2024
131654
Fiji
FJI
true
2
1
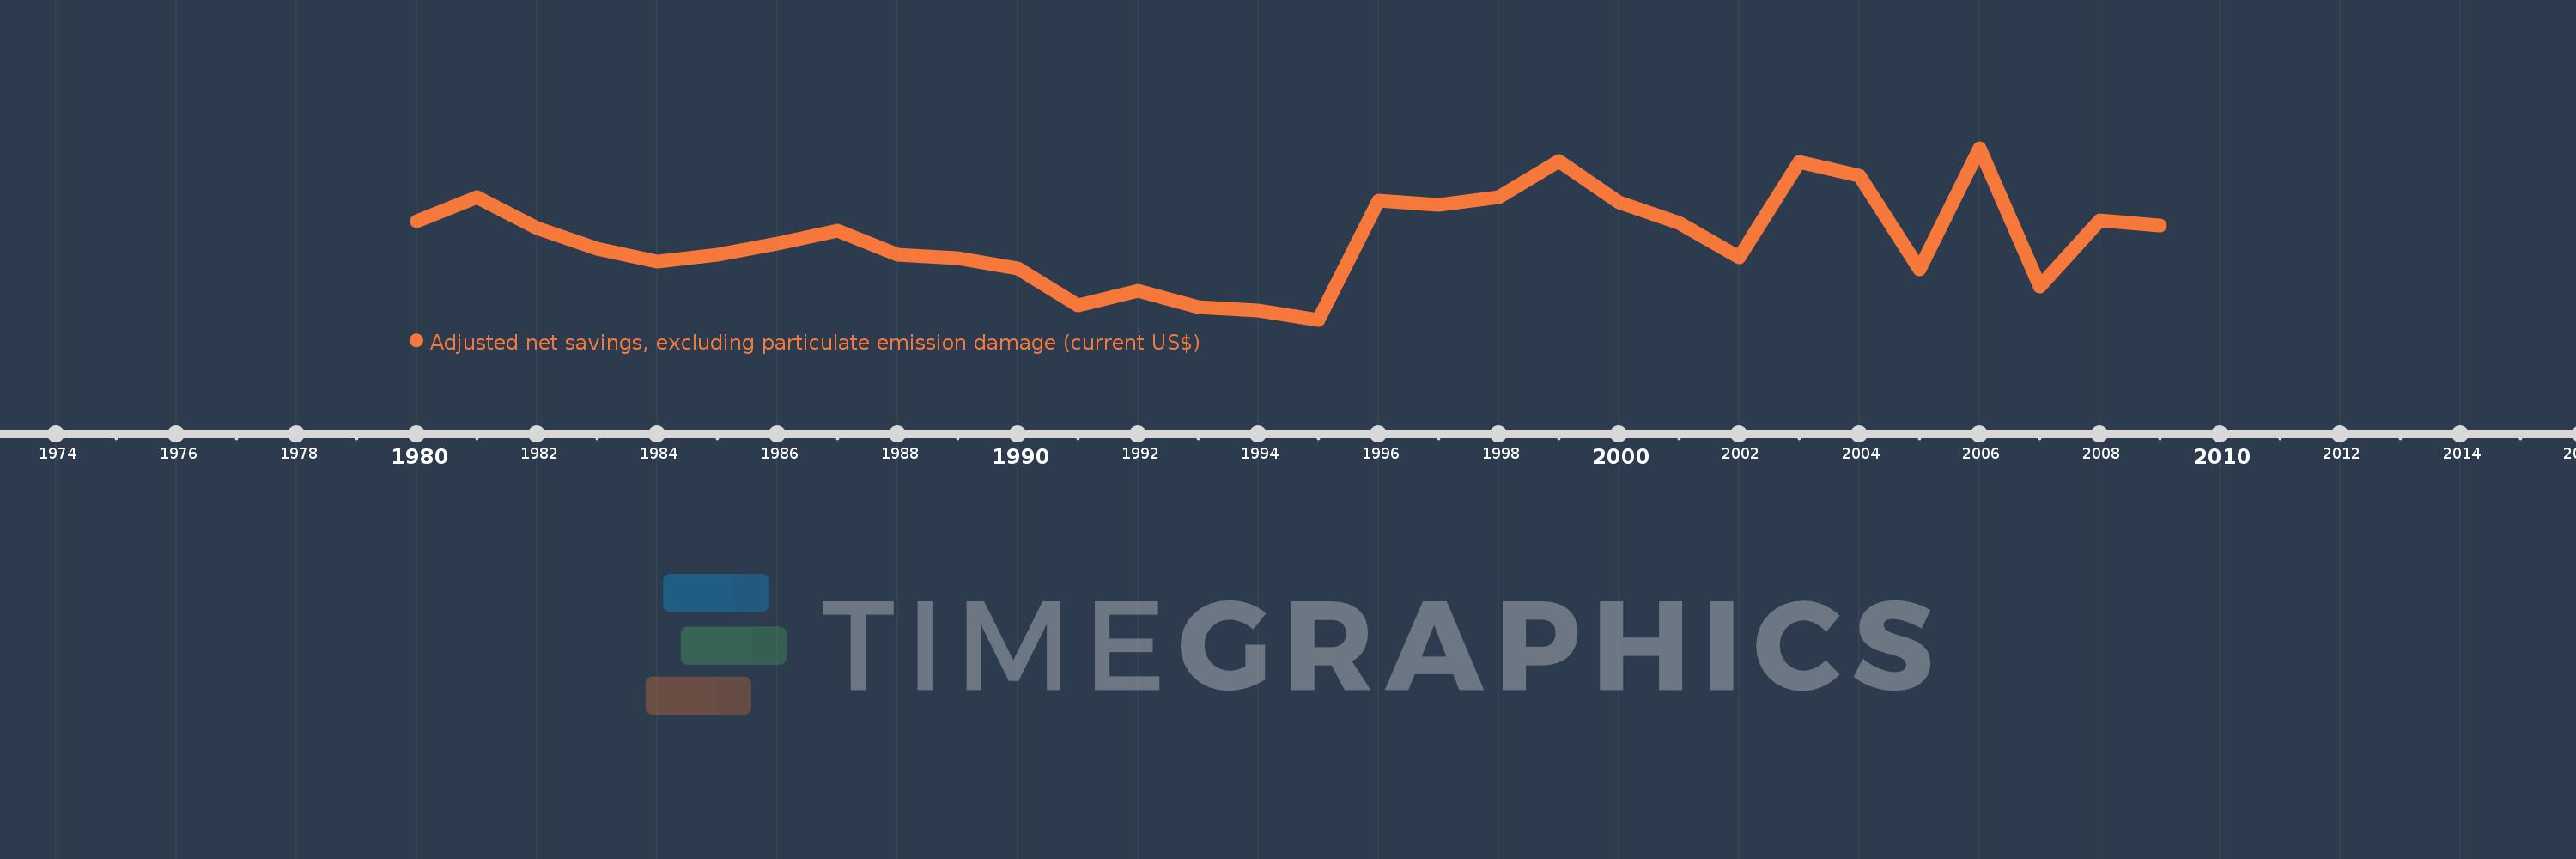
Adjusted net savings, excluding particulate emission damage (current US$)
2009,2008,2007,2006,2005,2004,2003,2002,2001,2000,1999,1998,1997,1996,1995,1994,1993,1992,1991,1990,1989,1988,1987,1986,1985,1984,1983,1982,1981,1980
This statistics in other country:
AfghanistanAlbaniaAlgeriaAngolaArgentinaArmeniaAustraliaAustriaAzerbaijanBahamas, TheBahrainBangladeshBarbadosBelarusBelgiumBelizeBeninBhutanBoliviaBotswanaBrazilBrunei DarussalamBulgariaBurkina FasoBurundiCabo VerdeCambodiaCameroonCanadaCentral African RepublicChadChileChinaColombiaComorosCongo, Dem. Rep.Congo, Rep.Costa RicaCote d'IvoireCroatiaCyprusCzech RepublicDenmarkDjiboutiDominicaDominican RepublicEcuadorEgypt, Arab Rep.El SalvadorEquatorial GuineaEritreaEstoniaEthiopiaFijiFinlandFranceGabonGambia, TheGeorgiaGermanyGhanaGreeceGuatemalaGuineaGuinea-BissauGuyanaHaitiHondurasHungaryIcelandIndiaIndonesiaIran, Islamic Rep.IraqIrelandIsraelItalyJamaicaJapanJordanKazakhstanKenyaKiribatiKorea, Rep.KuwaitKyrgyz RepublicLao PDRLatviaLebanonLesothoLiberiaLibyaLithuaniaLuxembourgMacedonia, FYRMadagascarMalawiMalaysiaMaldivesMaliMauritaniaMauritiusMexicoMoldovaMongoliaMoroccoMozambiqueNamibiaNepalNetherlandsNew ZealandNicaraguaNigerNigeriaNorwayOmanPakistanPanamaPapua New GuineaParaguayPeruPhilippinesPolandPortugalQatarRomaniaRussian FederationRwandaSaudi ArabiaSenegalSeychellesSierra LeoneSingaporeSlovak RepublicSloveniaSolomon IslandsSouth AfricaSpainSri LankaSt. LuciaSt. Vincent and the GrenadinesSudanSurinameSwazilandSwedenSwitzerlandSyrian Arab RepublicTajikistanTanzaniaThailandTogoTongaTrinidad and TobagoTunisiaTurkeyUgandaUkraineUnited KingdomUnited StatesUruguayVanuatuVenezuela, RBVietnamYemen, Rep.ZambiaZimbabwe Timeline:
This timeline shows a graph from 1980 to 2009 of Fiji. No data until 1979. Number of actual observations by date: 30.
Source name:
World Development Indicators
Source organization:
World Bank staff estimates based on sources and methods in World Bank's "The Changing Wealth of Nations: Measuring Sustainable Development in the New Millennium" (2011).
Categories, topics:
Economy & Growth, Environment
Last updated:
apr 23, 2017
Indicators value changes by year
Minimum:
-52.045 mln
jan 1, 1995
Maximum:
397.907 mln
jan 1, 2006
At the date of observation
Value
Absolute change
Change from previous value
jan 1, 1980
205.557 mln
+205.557 mln
0.0%
jan 1, 1981
269.673 mln
+64.116 mln
31.19%
jan 1, 1982
188.262 mln
-81.411 mln
-30.19%
jan 1, 1983
134.305 mln
-53.957 mln
-28.66%
jan 1, 1984
100.598 mln
-33.707 mln
-25.1%
jan 1, 1985
117.278 mln
+16.68 mln
16.58%
jan 1, 1986
148.251 mln
+30.973 mln
26.41%
jan 1, 1987
182.255 mln
+34.004 mln
22.94%
jan 1, 1988
118.505 mln
-63.749 mln
-34.98%
jan 1, 1989
109.309 mln
-9.196 mln
-7.76%
jan 1, 1990
81.385 mln
-27.924 mln
-25.55%
jan 1, 1991
-14.603 mln
-95.988 mln
-117.94%
jan 1, 1992
23.981 mln
+38.584 mln
-264.22%
jan 1, 1993
-19.78 mln
-43.761 mln
-182.48%
jan 1, 1994
-28.206 mln
-8.427 mln
42.6%
jan 1, 1995
-52.045 mln
-23.838 mln
84.51%
jan 1, 1996
259.479 mln
+311.524 mln
-598.57%
jan 1, 1997
249.425 mln
-10.054 mln
-3.87%
jan 1, 1998
268.48 mln
+19.055 mln
7.64%
jan 1, 1999
363.712 mln
+95.232 mln
35.47%
jan 1, 2000
254.92 mln
-108.792 mln
-29.91%
jan 1, 2001
201.946 mln
-52.974 mln
-20.78%
jan 1, 2002
112.153 mln
-89.793 mln
-44.46%
jan 1, 2003
360.709 mln
+248.556 mln
221.62%
jan 1, 2004
324.672 mln
-36.037 mln
-9.99%
jan 1, 2005
79.882 mln
-244.79 mln
-75.4%
jan 1, 2006
397.907 mln
+318.025 mln
398.12%
jan 1, 2007
34.442 mln
-363.465 mln
-91.34%
jan 1, 2008
209.122 mln
+174.68 mln
507.17%
jan 1, 2009
195.158 mln
-13.964 mln
-6.68%
Ranking of countries by current statistics by years


Comments: