29
/
en
AIzaSyAYiBZKx7MnpbEhh9jyipgxe19OcubqV5w
April 1, 2024
79151
Barbados
BRB
true
2
1
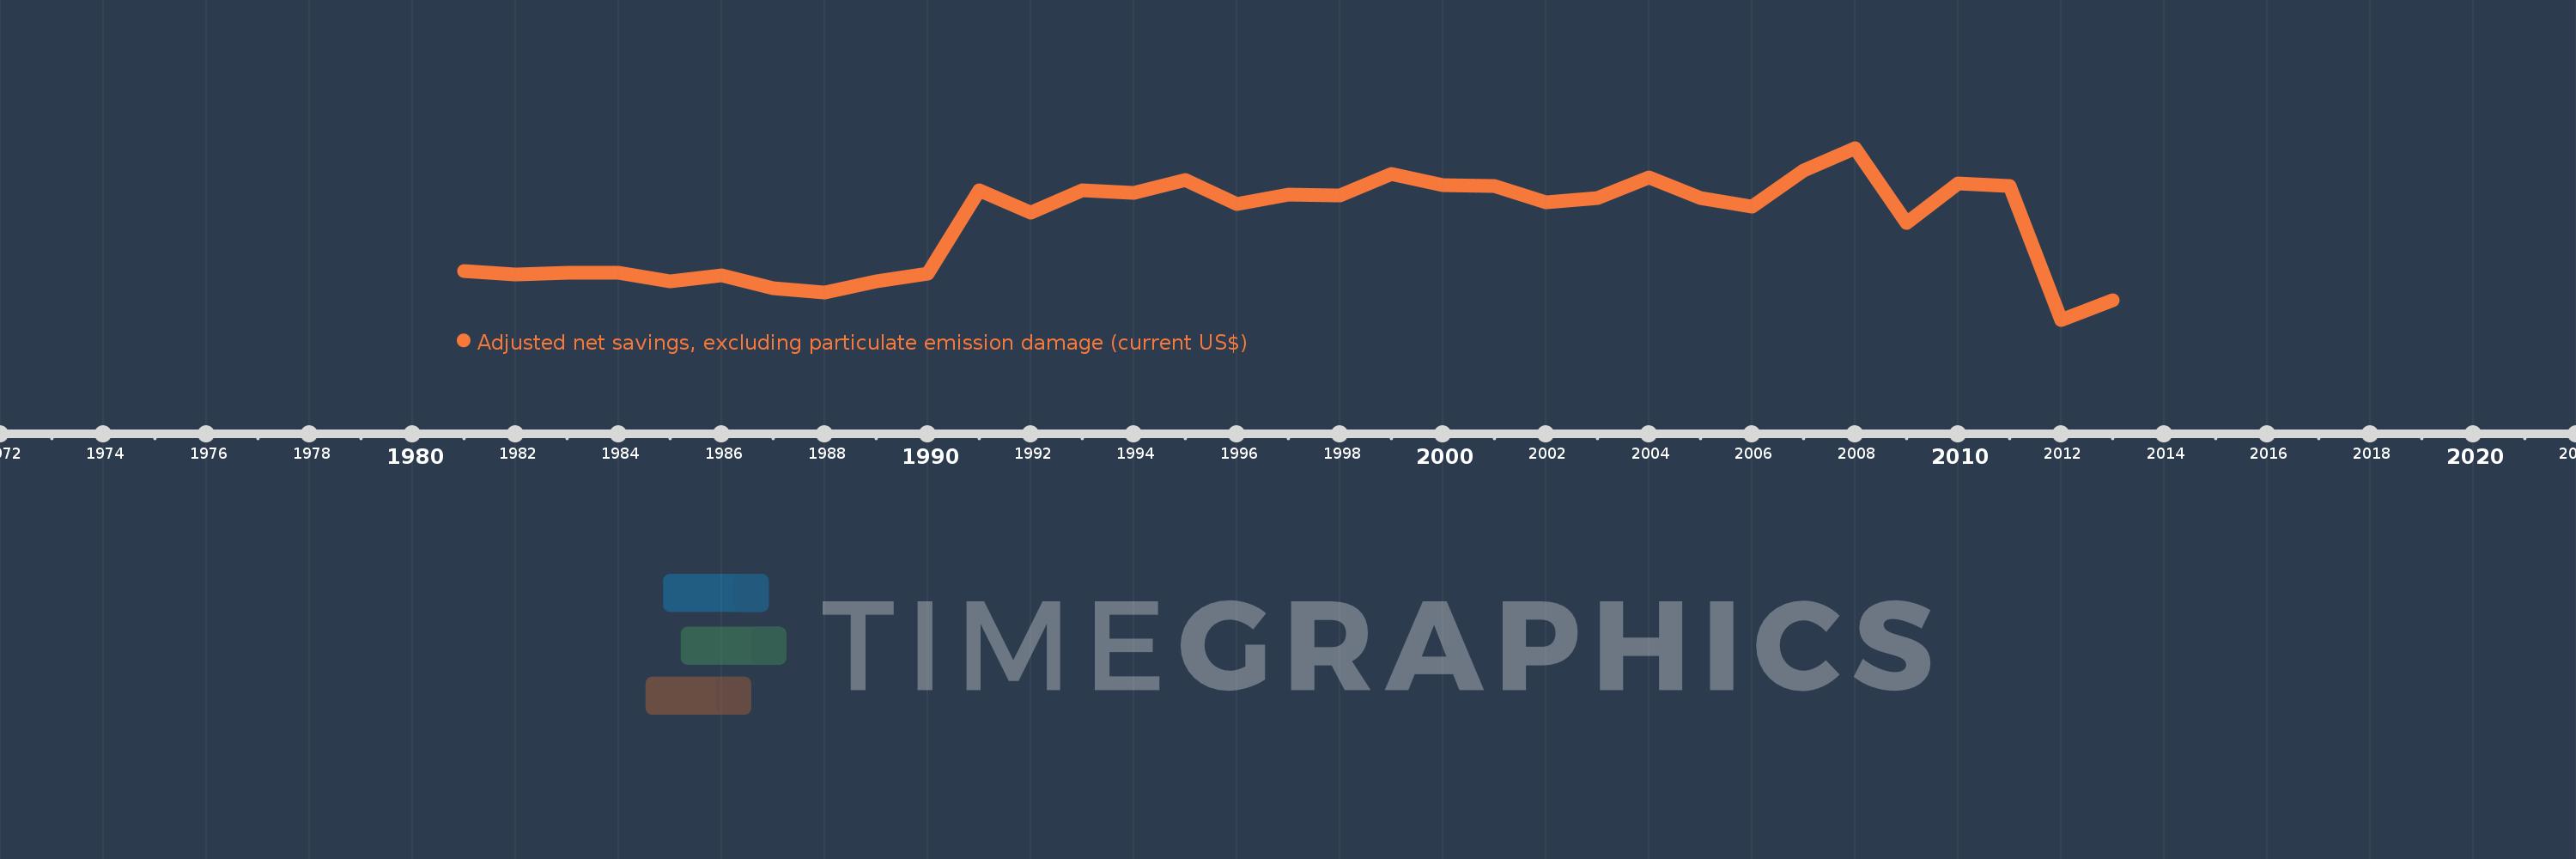
Adjusted net savings, excluding particulate emission damage (current US$)
2013,2012,2011,2010,2009,2008,2007,2006,2005,2004,2003,2002,2001,2000,1999,1998,1997,1996,1995,1994,1993,1992,1991,1990,1989,1988,1987,1986,1985,1984,1983,1982,1981
This statistics in other country:
AfghanistanAlbaniaAlgeriaAngolaArgentinaArmeniaAustraliaAustriaAzerbaijanBahamas, TheBahrainBangladeshBarbadosBelarusBelgiumBelizeBeninBhutanBoliviaBotswanaBrazilBrunei DarussalamBulgariaBurkina FasoBurundiCabo VerdeCambodiaCameroonCanadaCentral African RepublicChadChileChinaColombiaComorosCongo, Dem. Rep.Congo, Rep.Costa RicaCote d'IvoireCroatiaCyprusCzech RepublicDenmarkDjiboutiDominicaDominican RepublicEcuadorEgypt, Arab Rep.El SalvadorEquatorial GuineaEritreaEstoniaEthiopiaFijiFinlandFranceGabonGambia, TheGeorgiaGermanyGhanaGreeceGuatemalaGuineaGuinea-BissauGuyanaHaitiHondurasHungaryIcelandIndiaIndonesiaIran, Islamic Rep.IraqIrelandIsraelItalyJamaicaJapanJordanKazakhstanKenyaKiribatiKorea, Rep.KuwaitKyrgyz RepublicLao PDRLatviaLebanonLesothoLiberiaLibyaLithuaniaLuxembourgMacedonia, FYRMadagascarMalawiMalaysiaMaldivesMaliMauritaniaMauritiusMexicoMoldovaMongoliaMoroccoMozambiqueNamibiaNepalNetherlandsNew ZealandNicaraguaNigerNigeriaNorwayOmanPakistanPanamaPapua New GuineaParaguayPeruPhilippinesPolandPortugalQatarRomaniaRussian FederationRwandaSaudi ArabiaSenegalSeychellesSierra LeoneSingaporeSlovak RepublicSloveniaSolomon IslandsSouth AfricaSpainSri LankaSt. LuciaSt. Vincent and the GrenadinesSudanSurinameSwazilandSwedenSwitzerlandSyrian Arab RepublicTajikistanTanzaniaThailandTogoTongaTrinidad and TobagoTunisiaTurkeyUgandaUkraineUnited KingdomUnited StatesUruguayVanuatuVenezuela, RBVietnamYemen, Rep.ZambiaZimbabwe Timeline:
This timeline shows a graph from 1981 to 2013 of Barbados. No data until 1980. Number of actual observations by date: 33.
Source name:
World Development Indicators
Source organization:
World Bank staff estimates based on sources and methods in World Bank's "The Changing Wealth of Nations: Measuring Sustainable Development in the New Millennium" (2011).
Categories, topics:
Economy & Growth, Environment
Last updated:
apr 23, 2017
Indicators value changes by year
Minimum:
-76.55 mln
jan 1, 2012
Maximum:
582.784 mln
jan 1, 2008
At the date of observation
Value
Absolute change
Change from previous value
jan 1, 1981
110.8 mln
+110.8 mln
0.0%
jan 1, 1982
98.391 mln
-12.409 mln
-11.2%
jan 1, 1983
102.559 mln
+4.169 mln
4.24%
jan 1, 1984
105.129 mln
+2.57 mln
2.51%
jan 1, 1985
70.988 mln
-34.141 mln
-32.48%
jan 1, 1986
92.988 mln
+22.0 mln
30.99%
jan 1, 1987
45.297 mln
-47.692 mln
-51.29%
jan 1, 1988
27.6 mln
-17.696 mln
-39.07%
jan 1, 1989
70.331 mln
+42.73 mln
154.82%
jan 1, 1990
101.428 mln
+31.097 mln
44.22%
jan 1, 1991
419.139 mln
+317.711 mln
313.24%
jan 1, 1992
335.409 mln
-83.731 mln
-19.98%
jan 1, 1993
419.913 mln
+84.504 mln
25.19%
jan 1, 1994
408.815 mln
-11.098 mln
-2.64%
jan 1, 1995
460.4 mln
+51.585 mln
12.62%
jan 1, 1996
366.19 mln
-94.21 mln
-20.46%
jan 1, 1997
405.386 mln
+39.196 mln
10.7%
jan 1, 1998
400.39 mln
-4.996 mln
-1.23%
jan 1, 1999
482.658 mln
+82.268 mln
20.55%
jan 1, 2000
440.041 mln
-42.618 mln
-8.83%
jan 1, 2001
436.73 mln
-3.311 mln
-0.75%
jan 1, 2002
372.891 mln
-63.839 mln
-14.62%
jan 1, 2003
390.261 mln
+17.37 mln
4.66%
jan 1, 2004
469.39 mln
+79.129 mln
20.28%
jan 1, 2005
390.09 mln
-79.3 mln
-16.89%
jan 1, 2006
358.396 mln
-31.694 mln
-8.12%
jan 1, 2007
496.565 mln
+138.169 mln
38.55%
jan 1, 2008
582.784 mln
+86.219 mln
17.36%
jan 1, 2009
294.501 mln
-288.283 mln
-49.47%
jan 1, 2010
445.676 mln
+151.175 mln
51.33%
jan 1, 2011
436.942 mln
-8.734 mln
-1.96%
jan 1, 2012
-76.55 mln
-513.492 mln
-117.52%
jan 1, 2013
-1.65 mln
+74.9 mln
-97.84%
Ranking of countries by current statistics by years


Comments: