29
/
en
AIzaSyAYiBZKx7MnpbEhh9jyipgxe19OcubqV5w
April 1, 2024
96821
Burundi
BDI
true
2
1
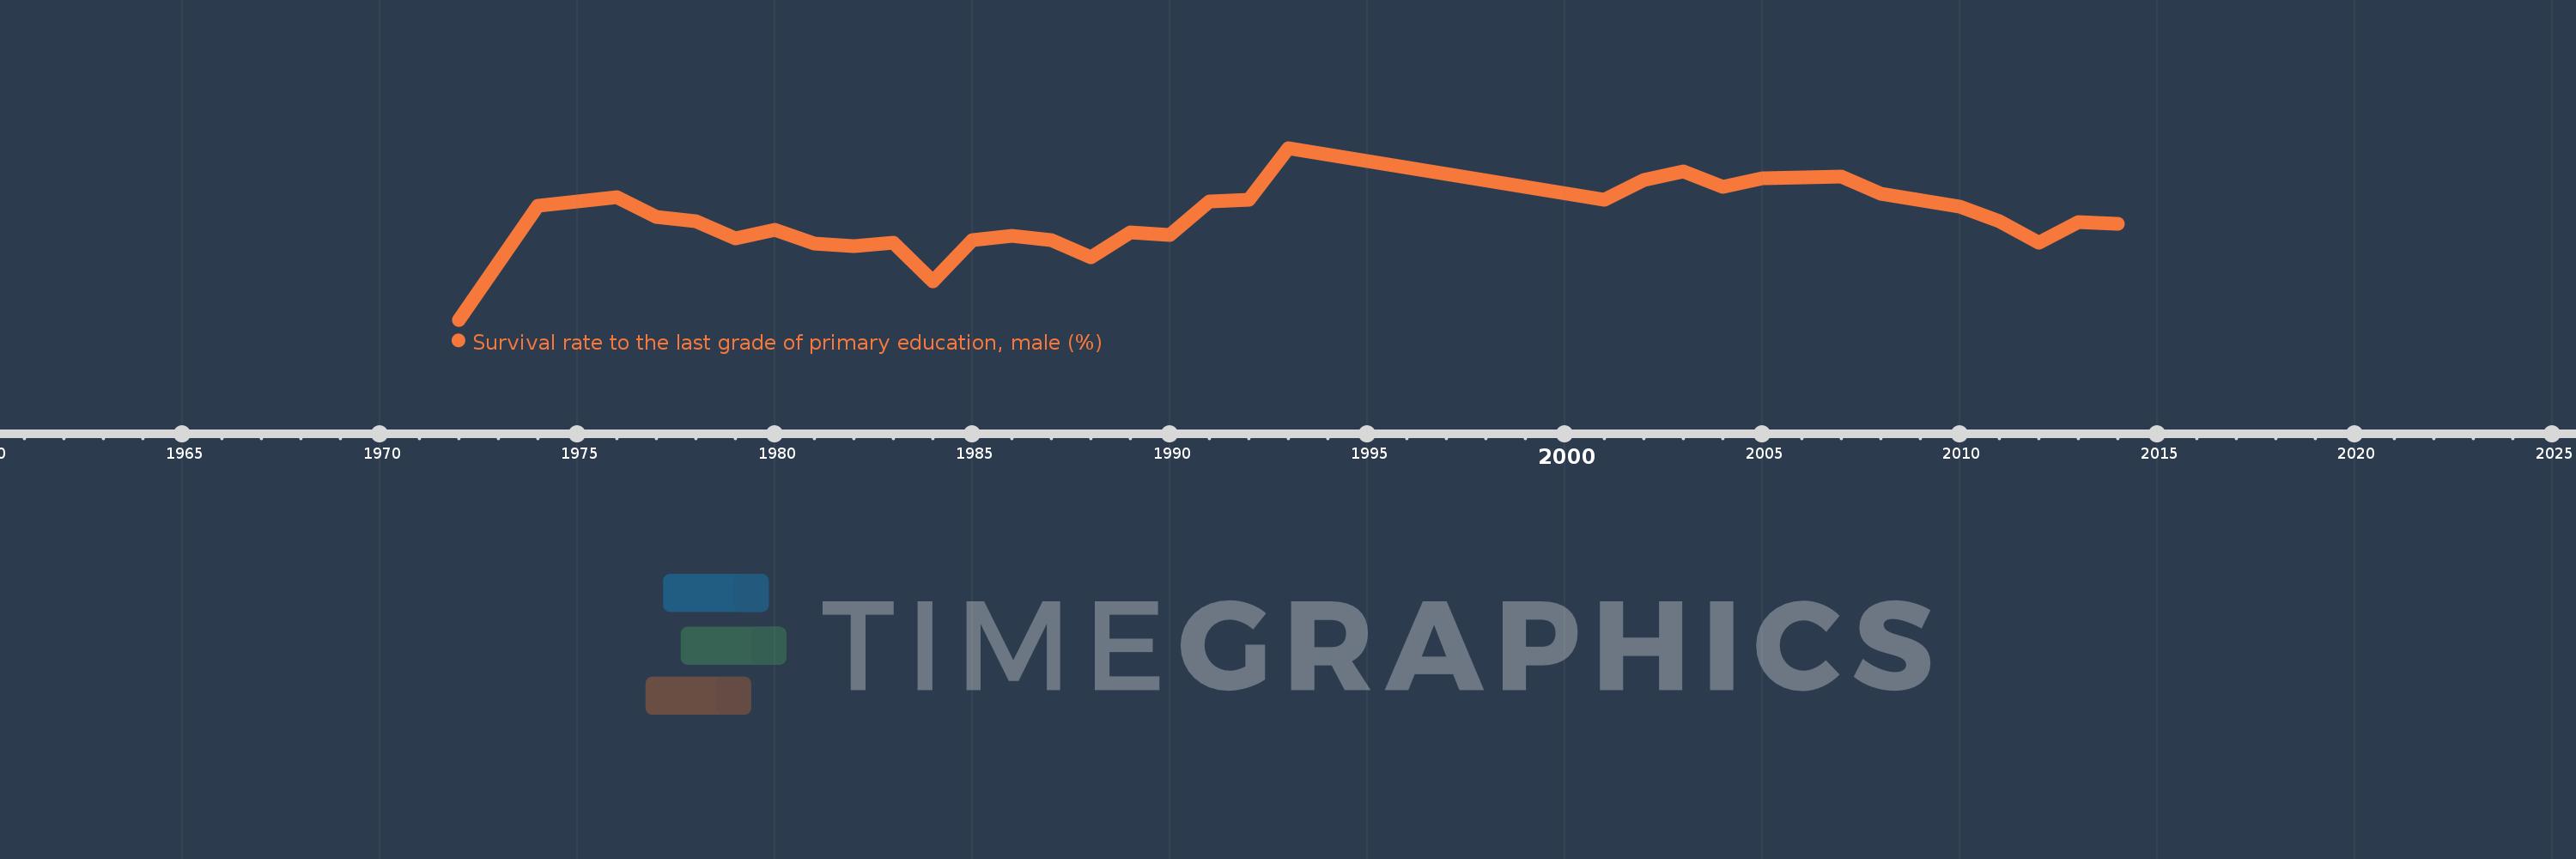
Survival rate to the last grade of primary education, male (%)
2014,2013,2012,2011,2010,2008,2007,2005,2004,2003,2002,2001,1993,1992,1991,1990,1989,1988,1987,1986,1985,1984,1983,1982,1981,1980,1979,1978,1977,1976,1974,1972
This statistics in other country:
AfghanistanAlbaniaAlgeriaAndorraAngolaArab WorldArgentinaArmeniaArubaAustriaAzerbaijanBahamas, TheBahrainBangladeshBarbadosBelarusBelgiumBelizeBeninBermudaBhutanBoliviaBosnia and HerzegovinaBotswanaBrazilBrunei DarussalamBulgariaBurkina FasoBurundiCabo VerdeCambodiaCameroonCanadaCaribbean small statesCentral African RepublicCentral Europe and the BalticsChadChileChinaColombiaComorosCongo, Dem. Rep.Congo, Rep.Costa RicaCote d'IvoireCroatiaCubaCyprusCzech RepublicDenmarkDjiboutiDominicaDominican RepublicEarly-demographic dividendEast Asia & PacificEast Asia & Pacific (excluding high income)East Asia & Pacific (IDA & IBRD countries)EcuadorEgypt, Arab Rep.El SalvadorEquatorial GuineaEritreaEstoniaEthiopiaEuro areaEurope & Central AsiaEurope & Central Asia (excluding high income)Europe & Central Asia (IDA & IBRD countries)European UnionFijiFinlandFragile and conflict affected situationsFranceGabonGambia, TheGeorgiaGermanyGhanaGreeceGuatemalaGuineaGuinea-BissauGuyanaHaitiHeavily indebted poor countries (HIPC)High incomeHondurasHong Kong SAR, ChinaHungaryIBRD onlyIcelandIDA & IBRD totalIDA blendIDA onlyIDA totalIndiaIndonesiaIran, Islamic Rep.IraqIsraelItalyJamaicaJapanJordanKazakhstanKenyaKiribatiKorea, Rep.KuwaitKyrgyz RepublicLao PDRLate-demographic dividendLatin America & Caribbean Latin America & Caribbean (excluding high income)Latin America & the Caribbean (IDA & IBRD countries)LatviaLeast developed countries: UN classificationLebanonLesothoLiberiaLibyaLiechtensteinLithuaniaLow & middle incomeLow incomeLower middle incomeLuxembourgMacao SAR, ChinaMacedonia, FYRMadagascarMalawiMalaysiaMaldivesMaliMaltaMarshall IslandsMauritaniaMauritiusMexicoMiddle East & North AfricaMiddle East & North Africa (excluding high income)Middle East & North Africa (IDA & IBRD countries)Middle incomeMoldovaMongoliaMontenegroMoroccoMozambiqueMyanmarNamibiaNepalNetherlandsNicaraguaNigerNigeriaNorth AmericaNorwayOECD membersOmanOther small statesPacific island small statesPakistanPanamaPapua New GuineaParaguayPeruPhilippinesPolandPortugalPost-demographic dividendPre-demographic dividendQatarRomaniaRussian FederationRwandaSamoaSan MarinoSao Tome and PrincipeSaudi ArabiaSenegalSerbiaSeychellesSierra LeoneSingaporeSlovak RepublicSloveniaSmall statesSolomon IslandsSouth AfricaSouth AsiaSouth Asia (IDA & IBRD)SpainSri LankaSt. Kitts and NevisSt. LuciaSt. Vincent and the GrenadinesSub-Saharan Africa Sub-Saharan Africa (excluding high income)Sub-Saharan Africa (IDA & IBRD countries)SudanSurinameSwazilandSwedenSwitzerlandSyrian Arab RepublicTajikistanTanzaniaThailandTimor-LesteTogoTongaTrinidad and TobagoTunisiaTurkeyUgandaUkraineUnited Arab EmiratesUpper middle incomeUruguayUzbekistanVanuatuVenezuela, RBVietnamWest Bank and GazaWorldYemen, Rep.ZambiaZimbabwe Timeline:
This timeline shows a graph from 1972 to 2014 of Burundi. No data until 1971. Number of actual observations by date: 32.
Source name:
World Development Indicators
Source organization:
UNESCO Institute for Statistics
Categories, topics:
Education, Gender
Last updated:
apr 23, 2017
Indicators value changes by year
Minimum:
16.185
jan 1, 1972
Maximum:
70.407
jan 1, 1993
At the date of observation
Value
Absolute change
Change from previous value
jan 1, 1972
16.185
+16.185
0.0%
jan 1, 1974
52.211
+36.027
222.6%
jan 1, 1976
55.002
+2.791
5.34%
jan 1, 1977
48.66
-6.342
-11.53%
jan 1, 1978
47.348
-1.311
-2.7%
jan 1, 1979
41.761
-5.587
-11.8%
jan 1, 1980
44.667
+2.906
6.96%
jan 1, 1981
40.244
-4.422
-9.9%
jan 1, 1982
39.326
-0.918
-2.28%
jan 1, 1983
40.397
+1.071
2.72%
jan 1, 1984
28.2
-12.198
-30.19%
jan 1, 1985
41.38
+13.18
46.74%
jan 1, 1986
42.548
+1.169
2.82%
jan 1, 1987
41.212
-1.337
-3.14%
jan 1, 1988
35.764
-5.448
-13.22%
jan 1, 1989
43.887
+8.123
22.71%
jan 1, 1990
43.041
-0.845
-1.93%
jan 1, 1991
53.546
+10.505
24.41%
jan 1, 1992
54.113
+0.567
1.06%
jan 1, 1993
70.407
+16.293
30.11%
jan 1, 2001
53.98
-16.426
-23.33%
jan 1, 2002
60.403
+6.422
11.9%
jan 1, 2003
63.071
+2.669
4.42%
jan 1, 2004
58.019
-5.053
-8.01%
jan 1, 2005
60.719
+2.701
4.66%
jan 1, 2007
61.472
+0.753
1.24%
jan 1, 2008
55.948
-5.524
-8.99%
jan 1, 2010
51.839
-4.109
-7.34%
jan 1, 2011
47.258
-4.581
-8.84%
jan 1, 2012
40.527
-6.731
-14.24%
jan 1, 2013
47.052
+6.525
16.1%
jan 1, 2014
46.527
-0.525
-1.12%
Ranking of countries by current statistics by years


Comments: