29
/
en
AIzaSyAYiBZKx7MnpbEhh9jyipgxe19OcubqV5w
April 1, 2024
55190
Post-demographic dividend
PST
false
2
1
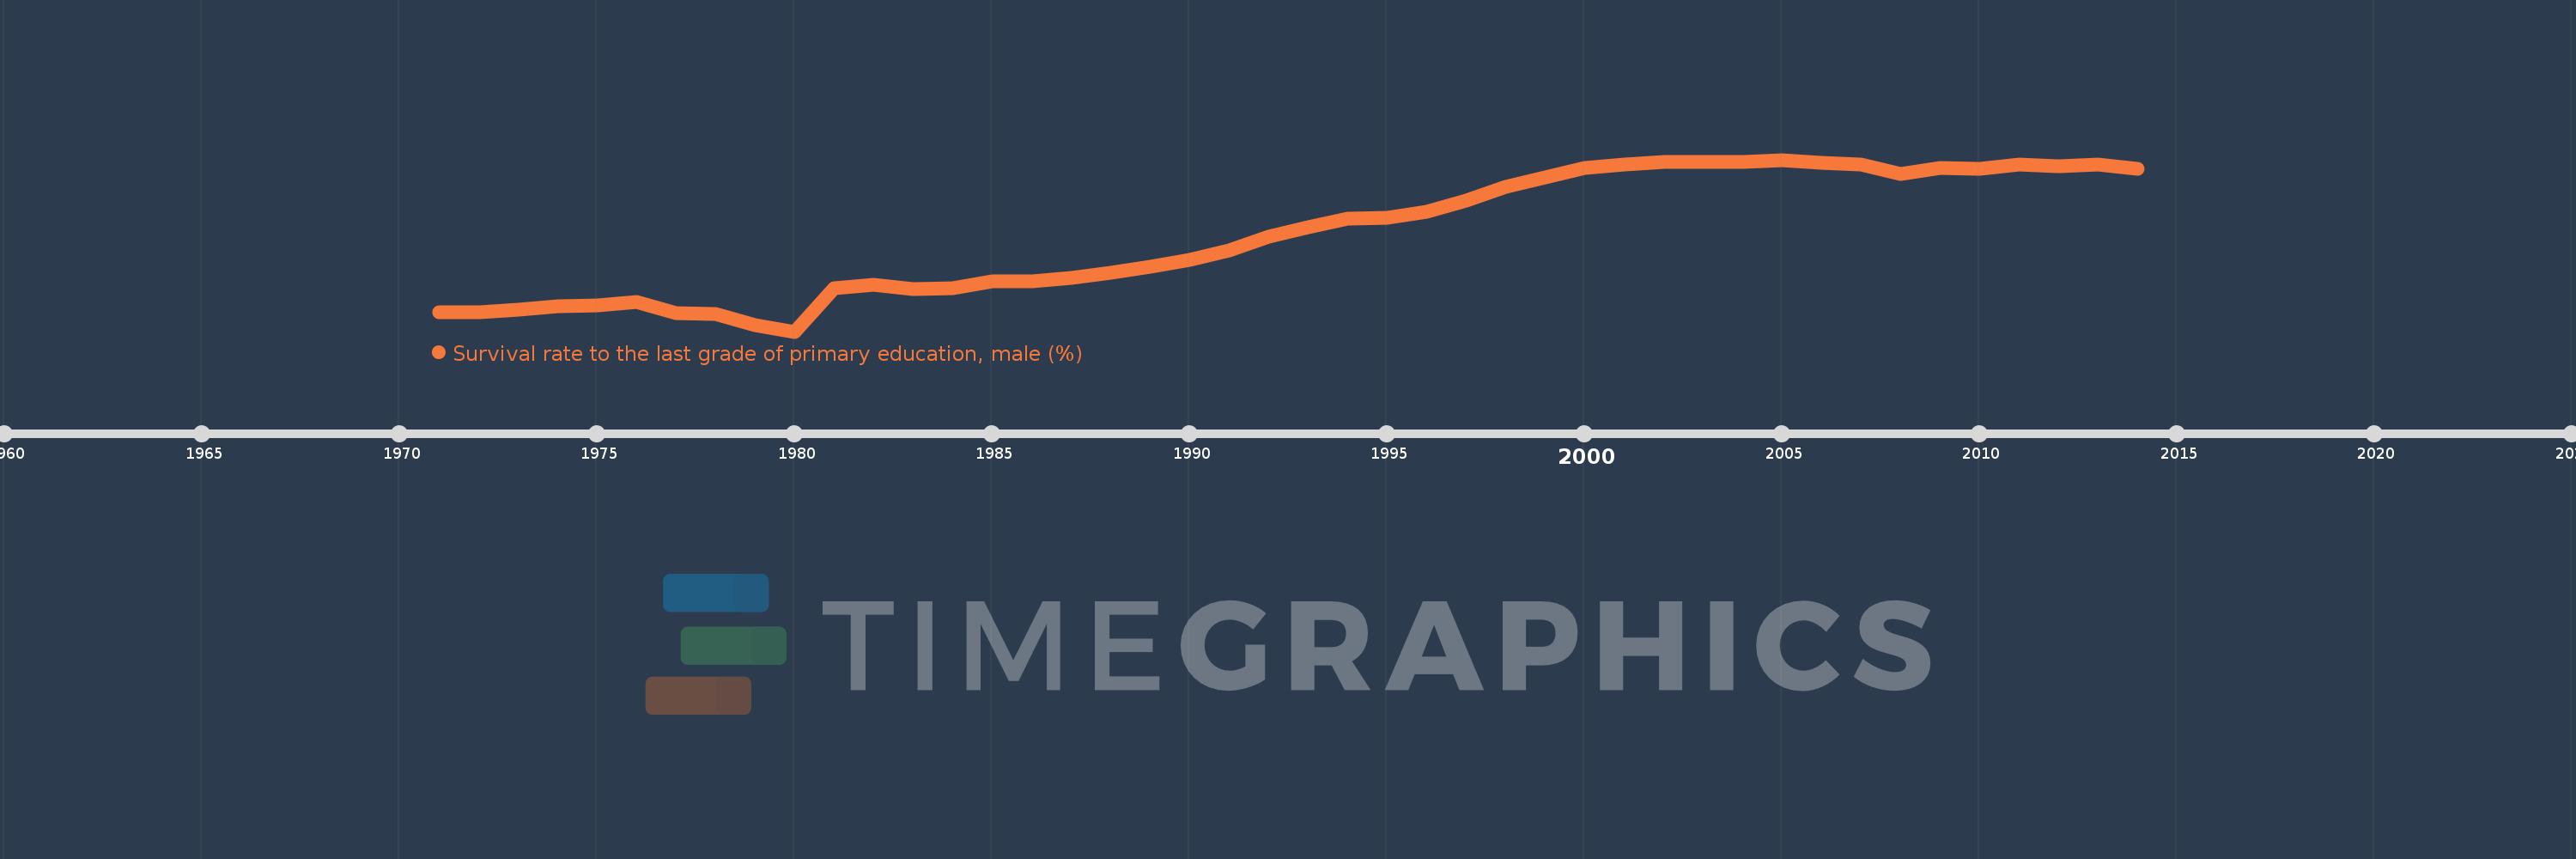
Survival rate to the last grade of primary education, male (%)
2014,2013,2012,2011,2010,2009,2008,2007,2006,2005,2004,2003,2002,2001,2000,1999,1998,1997,1996,1995,1994,1993,1992,1991,1990,1989,1988,1987,1986,1985,1984,1983,1982,1981,1980,1979,1978,1977,1976,1975,1974,1973,1972,1971
This statistics in other country:
AfghanistanAlbaniaAlgeriaAndorraAngolaArab WorldArgentinaArmeniaArubaAustriaAzerbaijanBahamas, TheBahrainBangladeshBarbadosBelarusBelgiumBelizeBeninBermudaBhutanBoliviaBosnia and HerzegovinaBotswanaBrazilBrunei DarussalamBulgariaBurkina FasoBurundiCabo VerdeCambodiaCameroonCanadaCaribbean small statesCentral African RepublicCentral Europe and the BalticsChadChileChinaColombiaComorosCongo, Dem. Rep.Congo, Rep.Costa RicaCote d'IvoireCroatiaCubaCyprusCzech RepublicDenmarkDjiboutiDominicaDominican RepublicEarly-demographic dividendEast Asia & PacificEast Asia & Pacific (excluding high income)East Asia & Pacific (IDA & IBRD countries)EcuadorEgypt, Arab Rep.El SalvadorEquatorial GuineaEritreaEstoniaEthiopiaEuro areaEurope & Central AsiaEurope & Central Asia (excluding high income)Europe & Central Asia (IDA & IBRD countries)European UnionFijiFinlandFragile and conflict affected situationsFranceGabonGambia, TheGeorgiaGermanyGhanaGreeceGuatemalaGuineaGuinea-BissauGuyanaHaitiHeavily indebted poor countries (HIPC)High incomeHondurasHong Kong SAR, ChinaHungaryIBRD onlyIcelandIDA & IBRD totalIDA blendIDA onlyIDA totalIndiaIndonesiaIran, Islamic Rep.IraqIsraelItalyJamaicaJapanJordanKazakhstanKenyaKiribatiKorea, Rep.KuwaitKyrgyz RepublicLao PDRLate-demographic dividendLatin America & Caribbean Latin America & Caribbean (excluding high income)Latin America & the Caribbean (IDA & IBRD countries)LatviaLeast developed countries: UN classificationLebanonLesothoLiberiaLibyaLiechtensteinLithuaniaLow & middle incomeLow incomeLower middle incomeLuxembourgMacao SAR, ChinaMacedonia, FYRMadagascarMalawiMalaysiaMaldivesMaliMaltaMarshall IslandsMauritaniaMauritiusMexicoMiddle East & North AfricaMiddle East & North Africa (excluding high income)Middle East & North Africa (IDA & IBRD countries)Middle incomeMoldovaMongoliaMontenegroMoroccoMozambiqueMyanmarNamibiaNepalNetherlandsNicaraguaNigerNigeriaNorth AmericaNorwayOECD membersOmanOther small statesPacific island small statesPakistanPanamaPapua New GuineaParaguayPeruPhilippinesPolandPortugalPost-demographic dividendPre-demographic dividendQatarRomaniaRussian FederationRwandaSamoaSan MarinoSao Tome and PrincipeSaudi ArabiaSenegalSerbiaSeychellesSierra LeoneSingaporeSlovak RepublicSloveniaSmall statesSolomon IslandsSouth AfricaSouth AsiaSouth Asia (IDA & IBRD)SpainSri LankaSt. Kitts and NevisSt. LuciaSt. Vincent and the GrenadinesSub-Saharan Africa Sub-Saharan Africa (excluding high income)Sub-Saharan Africa (IDA & IBRD countries)SudanSurinameSwazilandSwedenSwitzerlandSyrian Arab RepublicTajikistanTanzaniaThailandTimor-LesteTogoTongaTrinidad and TobagoTunisiaTurkeyUgandaUkraineUnited Arab EmiratesUpper middle incomeUruguayUzbekistanVanuatuVenezuela, RBVietnamWest Bank and GazaWorldYemen, Rep.ZambiaZimbabwe Timeline:
This timeline shows a graph from 1971 to 2014 of Post-demographic dividend. No data until 1970. Number of actual observations by date: 44.
Source name:
World Development Indicators
Source organization:
UNESCO Institute for Statistics
Categories, topics:
Education, Gender
Last updated:
apr 23, 2017
Indicators value changes by year
Minimum:
85.844
jan 1, 1980
Maximum:
94.355
jan 1, 2005
At the date of observation
Value
Absolute change
Change from previous value
jan 1, 1971
86.809
+86.809
0.0%
jan 1, 1972
86.802
-0.007
-0.01%
jan 1, 1973
86.927
+0.125
0.14%
jan 1, 1974
87.111
+0.185
0.21%
jan 1, 1975
87.158
+0.047
0.05%
jan 1, 1976
87.293
+0.135
0.15%
jan 1, 1977
86.756
-0.537
-0.62%
jan 1, 1978
86.707
-0.049
-0.06%
jan 1, 1979
86.153
-0.554
-0.64%
jan 1, 1980
85.844
-0.309
-0.36%
jan 1, 1981
87.99
+2.145
2.5%
jan 1, 1982
88.176
+0.186
0.21%
jan 1, 1983
87.965
-0.211
-0.24%
jan 1, 1984
87.979
+0.015
0.02%
jan 1, 1985
88.325
+0.346
0.39%
jan 1, 1986
88.334
+0.009
0.01%
jan 1, 1987
88.487
+0.152
0.17%
jan 1, 1988
88.765
+0.278
0.31%
jan 1, 1989
89.073
+0.309
0.35%
jan 1, 1990
89.408
+0.334
0.38%
jan 1, 1991
89.88
+0.473
0.53%
jan 1, 1992
90.533
+0.653
0.73%
jan 1, 1993
91.01
+0.477
0.53%
jan 1, 1994
91.441
+0.431
0.47%
jan 1, 1995
91.478
+0.037
0.04%
jan 1, 1996
91.8
+0.323
0.35%
jan 1, 1997
92.332
+0.532
0.58%
jan 1, 1998
93.035
+0.703
0.76%
jan 1, 1999
93.472
+0.437
0.47%
jan 1, 2000
93.95
+0.477
0.51%
jan 1, 2001
94.132
+0.183
0.19%
jan 1, 2002
94.229
+0.096
0.1%
jan 1, 2003
94.235
+0.007
0.01%
jan 1, 2004
94.255
+0.019
0.02%
jan 1, 2005
94.355
+0.1
0.11%
jan 1, 2006
94.203
-0.152
-0.16%
jan 1, 2007
94.132
-0.071
-0.07%
jan 1, 2008
93.649
-0.483
-0.51%
jan 1, 2009
93.946
+0.297
0.32%
jan 1, 2010
93.903
-0.043
-0.05%
jan 1, 2011
94.122
+0.218
0.23%
jan 1, 2012
94.03
-0.092
-0.1%
jan 1, 2013
94.105
+0.075
0.08%
jan 1, 2014
93.911
-0.194
-0.21%
Ranking of countries by current statistics by years


Comments: