29
/
en
AIzaSyAYiBZKx7MnpbEhh9jyipgxe19OcubqV5w
April 1, 2024
231763
Rwanda
RWA
true
2
1
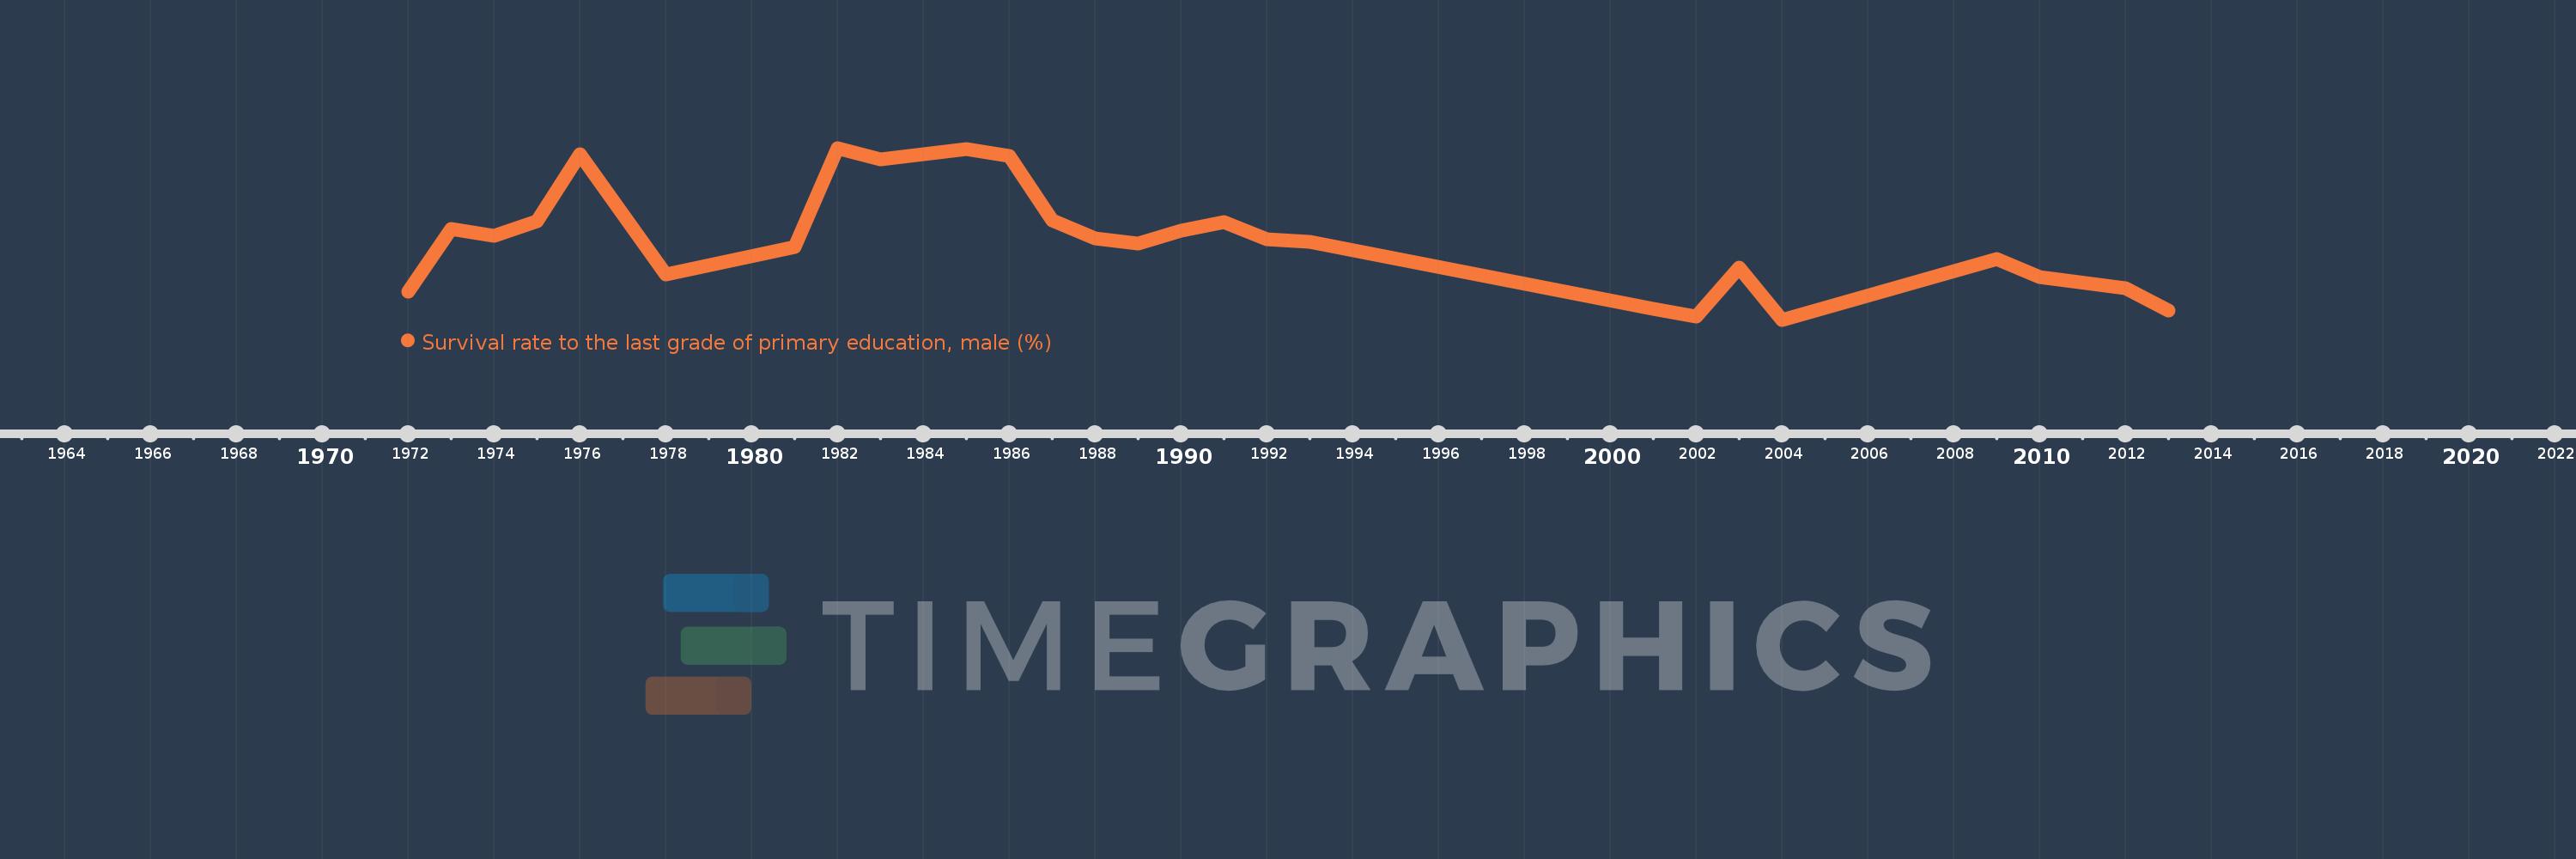
Survival rate to the last grade of primary education, male (%)
2013,2012,2010,2009,2004,2003,2002,2001,1993,1992,1991,1990,1989,1988,1987,1986,1985,1984,1983,1982,1981,1978,1976,1975,1974,1973,1972
This statistics in other country:
AfghanistanAlbaniaAlgeriaAndorraAngolaArab WorldArgentinaArmeniaArubaAustriaAzerbaijanBahamas, TheBahrainBangladeshBarbadosBelarusBelgiumBelizeBeninBermudaBhutanBoliviaBosnia and HerzegovinaBotswanaBrazilBrunei DarussalamBulgariaBurkina FasoBurundiCabo VerdeCambodiaCameroonCanadaCaribbean small statesCentral African RepublicCentral Europe and the BalticsChadChileChinaColombiaComorosCongo, Dem. Rep.Congo, Rep.Costa RicaCote d'IvoireCroatiaCubaCyprusCzech RepublicDenmarkDjiboutiDominicaDominican RepublicEarly-demographic dividendEast Asia & PacificEast Asia & Pacific (excluding high income)East Asia & Pacific (IDA & IBRD countries)EcuadorEgypt, Arab Rep.El SalvadorEquatorial GuineaEritreaEstoniaEthiopiaEuro areaEurope & Central AsiaEurope & Central Asia (excluding high income)Europe & Central Asia (IDA & IBRD countries)European UnionFijiFinlandFragile and conflict affected situationsFranceGabonGambia, TheGeorgiaGermanyGhanaGreeceGuatemalaGuineaGuinea-BissauGuyanaHaitiHeavily indebted poor countries (HIPC)High incomeHondurasHong Kong SAR, ChinaHungaryIBRD onlyIcelandIDA & IBRD totalIDA blendIDA onlyIDA totalIndiaIndonesiaIran, Islamic Rep.IraqIsraelItalyJamaicaJapanJordanKazakhstanKenyaKiribatiKorea, Rep.KuwaitKyrgyz RepublicLao PDRLate-demographic dividendLatin America & Caribbean Latin America & Caribbean (excluding high income)Latin America & the Caribbean (IDA & IBRD countries)LatviaLeast developed countries: UN classificationLebanonLesothoLiberiaLibyaLiechtensteinLithuaniaLow & middle incomeLow incomeLower middle incomeLuxembourgMacao SAR, ChinaMacedonia, FYRMadagascarMalawiMalaysiaMaldivesMaliMaltaMarshall IslandsMauritaniaMauritiusMexicoMiddle East & North AfricaMiddle East & North Africa (excluding high income)Middle East & North Africa (IDA & IBRD countries)Middle incomeMoldovaMongoliaMontenegroMoroccoMozambiqueMyanmarNamibiaNepalNetherlandsNicaraguaNigerNigeriaNorth AmericaNorwayOECD membersOmanOther small statesPacific island small statesPakistanPanamaPapua New GuineaParaguayPeruPhilippinesPolandPortugalPost-demographic dividendPre-demographic dividendQatarRomaniaRussian FederationRwandaSamoaSan MarinoSao Tome and PrincipeSaudi ArabiaSenegalSerbiaSeychellesSierra LeoneSingaporeSlovak RepublicSloveniaSmall statesSolomon IslandsSouth AfricaSouth AsiaSouth Asia (IDA & IBRD)SpainSri LankaSt. Kitts and NevisSt. LuciaSt. Vincent and the GrenadinesSub-Saharan Africa Sub-Saharan Africa (excluding high income)Sub-Saharan Africa (IDA & IBRD countries)SudanSurinameSwazilandSwedenSwitzerlandSyrian Arab RepublicTajikistanTanzaniaThailandTimor-LesteTogoTongaTrinidad and TobagoTunisiaTurkeyUgandaUkraineUnited Arab EmiratesUpper middle incomeUruguayUzbekistanVanuatuVenezuela, RBVietnamWest Bank and GazaWorldYemen, Rep.ZambiaZimbabwe Timeline:
This timeline shows a graph from 1972 to 2013 of Rwanda. No data until 1971. Number of actual observations by date: 27.
Source name:
World Development Indicators
Source organization:
UNESCO Institute for Statistics
Categories, topics:
Education, Gender
Last updated:
apr 23, 2017
Indicators value changes by year
Minimum:
29.923
jan 1, 2004
Maximum:
50.076
jan 1, 1982
At the date of observation
Value
Absolute change
Change from previous value
jan 1, 1972
33.223
+33.223
0.0%
jan 1, 1973
40.57
+7.348
22.12%
jan 1, 1974
39.728
-0.842
-2.08%
jan 1, 1975
41.522
+1.793
4.51%
jan 1, 1976
49.388
+7.866
18.95%
jan 1, 1978
35.252
-14.136
-28.62%
jan 1, 1981
38.508
+3.256
9.24%
jan 1, 1982
50.076
+11.568
30.04%
jan 1, 1983
48.751
-1.325
-2.65%
jan 1, 1984
49.359
+0.608
1.25%
jan 1, 1985
49.982
+0.623
1.26%
jan 1, 1986
49.176
-0.806
-1.61%
jan 1, 1987
41.549
-7.627
-15.51%
jan 1, 1988
39.498
-2.051
-4.94%
jan 1, 1989
38.862
-0.636
-1.61%
jan 1, 1990
40.415
+1.553
4.0%
jan 1, 1991
41.341
+0.926
2.29%
jan 1, 1992
39.362
-1.979
-4.79%
jan 1, 1993
39.072
-0.29
-0.74%
jan 1, 2001
31.156
-7.915
-20.26%
jan 1, 2002
30.279
-0.877
-2.82%
jan 1, 2003
36.08
+5.801
19.16%
jan 1, 2004
29.923
-6.157
-17.07%
jan 1, 2009
37.016
+7.093
23.7%
jan 1, 2010
34.975
-2.041
-5.51%
jan 1, 2012
33.631
-1.344
-3.84%
jan 1, 2013
30.968
-2.663
-7.92%
Ranking of countries by current statistics by years


Comments: