29
/
en
AIzaSyAYiBZKx7MnpbEhh9jyipgxe19OcubqV5w
April 1, 2024
63064
World
WLD
false
2
1
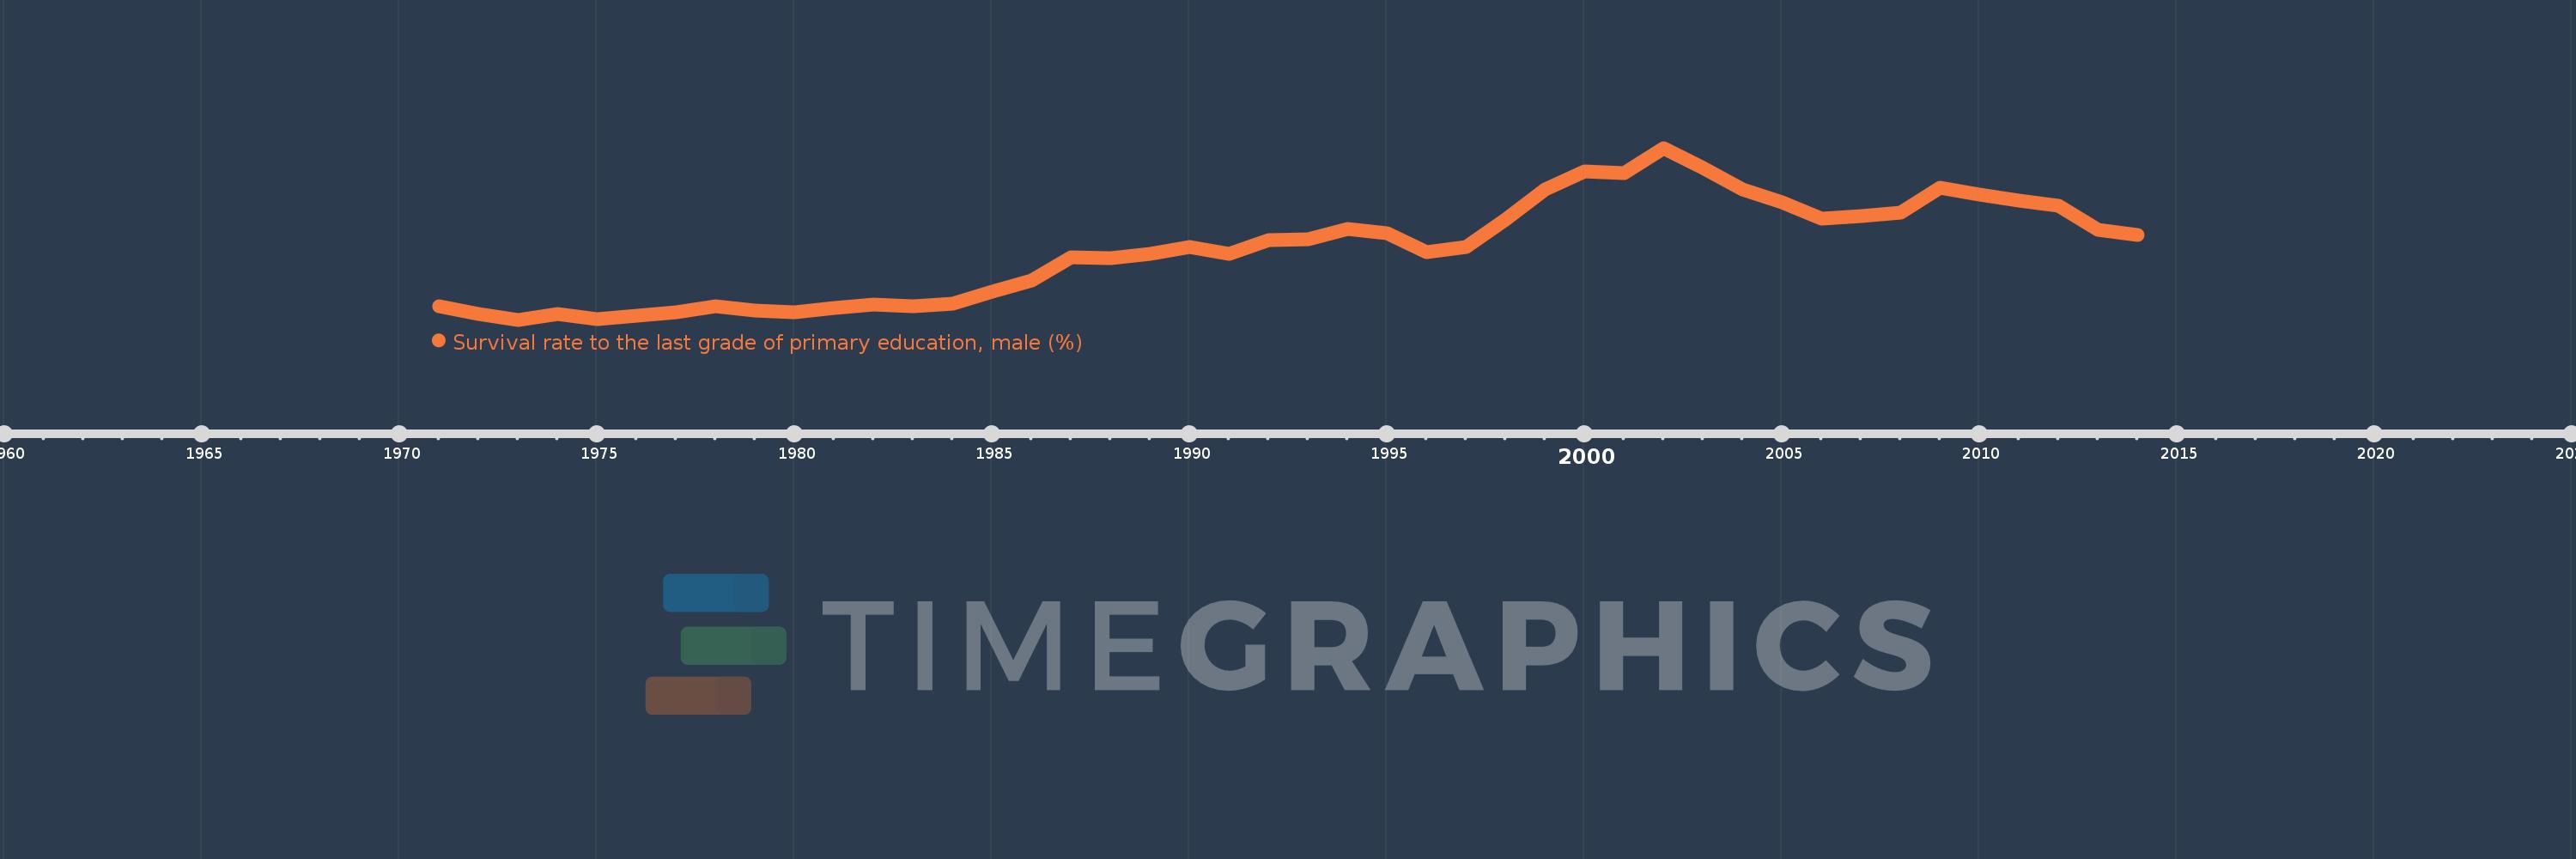
Survival rate to the last grade of primary education, male (%)
2014,2013,2012,2011,2010,2009,2008,2007,2006,2005,2004,2003,2002,2001,2000,1999,1998,1997,1996,1995,1994,1993,1992,1991,1990,1989,1988,1987,1986,1985,1984,1983,1982,1981,1980,1979,1978,1977,1976,1975,1974,1973,1972,1971
This statistics in other country:
AfghanistanAlbaniaAlgeriaAndorraAngolaArab WorldArgentinaArmeniaArubaAustriaAzerbaijanBahamas, TheBahrainBangladeshBarbadosBelarusBelgiumBelizeBeninBermudaBhutanBoliviaBosnia and HerzegovinaBotswanaBrazilBrunei DarussalamBulgariaBurkina FasoBurundiCabo VerdeCambodiaCameroonCanadaCaribbean small statesCentral African RepublicCentral Europe and the BalticsChadChileChinaColombiaComorosCongo, Dem. Rep.Congo, Rep.Costa RicaCote d'IvoireCroatiaCubaCyprusCzech RepublicDenmarkDjiboutiDominicaDominican RepublicEarly-demographic dividendEast Asia & PacificEast Asia & Pacific (excluding high income)East Asia & Pacific (IDA & IBRD countries)EcuadorEgypt, Arab Rep.El SalvadorEquatorial GuineaEritreaEstoniaEthiopiaEuro areaEurope & Central AsiaEurope & Central Asia (excluding high income)Europe & Central Asia (IDA & IBRD countries)European UnionFijiFinlandFragile and conflict affected situationsFranceGabonGambia, TheGeorgiaGermanyGhanaGreeceGuatemalaGuineaGuinea-BissauGuyanaHaitiHeavily indebted poor countries (HIPC)High incomeHondurasHong Kong SAR, ChinaHungaryIBRD onlyIcelandIDA & IBRD totalIDA blendIDA onlyIDA totalIndiaIndonesiaIran, Islamic Rep.IraqIsraelItalyJamaicaJapanJordanKazakhstanKenyaKiribatiKorea, Rep.KuwaitKyrgyz RepublicLao PDRLate-demographic dividendLatin America & Caribbean Latin America & Caribbean (excluding high income)Latin America & the Caribbean (IDA & IBRD countries)LatviaLeast developed countries: UN classificationLebanonLesothoLiberiaLibyaLiechtensteinLithuaniaLow & middle incomeLow incomeLower middle incomeLuxembourgMacao SAR, ChinaMacedonia, FYRMadagascarMalawiMalaysiaMaldivesMaliMaltaMarshall IslandsMauritaniaMauritiusMexicoMiddle East & North AfricaMiddle East & North Africa (excluding high income)Middle East & North Africa (IDA & IBRD countries)Middle incomeMoldovaMongoliaMontenegroMoroccoMozambiqueMyanmarNamibiaNepalNetherlandsNicaraguaNigerNigeriaNorth AmericaNorwayOECD membersOmanOther small statesPacific island small statesPakistanPanamaPapua New GuineaParaguayPeruPhilippinesPolandPortugalPost-demographic dividendPre-demographic dividendQatarRomaniaRussian FederationRwandaSamoaSan MarinoSao Tome and PrincipeSaudi ArabiaSenegalSerbiaSeychellesSierra LeoneSingaporeSlovak RepublicSloveniaSmall statesSolomon IslandsSouth AfricaSouth AsiaSouth Asia (IDA & IBRD)SpainSri LankaSt. Kitts and NevisSt. LuciaSt. Vincent and the GrenadinesSub-Saharan Africa Sub-Saharan Africa (excluding high income)Sub-Saharan Africa (IDA & IBRD countries)SudanSurinameSwazilandSwedenSwitzerlandSyrian Arab RepublicTajikistanTanzaniaThailandTimor-LesteTogoTongaTrinidad and TobagoTunisiaTurkeyUgandaUkraineUnited Arab EmiratesUpper middle incomeUruguayUzbekistanVanuatuVenezuela, RBVietnamWest Bank and GazaWorldYemen, Rep.ZambiaZimbabwe Timeline:
This timeline shows a graph from 1971 to 2014 of World. No data until 1970. Number of actual observations by date: 44.
Source name:
World Development Indicators
Source organization:
UNESCO Institute for Statistics
Categories, topics:
Education, Gender
Last updated:
apr 23, 2017
Indicators value changes by year
Minimum:
66.384
jan 1, 1973
At the date of observation
Value
Absolute change
Change from previous value
jan 1, 1971
67.184
+67.184
0.0%
jan 1, 1972
66.707
-0.478
-0.71%
jan 1, 1973
66.384
-0.323
-0.48%
jan 1, 1974
66.717
+0.333
0.5%
jan 1, 1975
66.427
-0.289
-0.43%
jan 1, 1976
66.634
+0.207
0.31%
jan 1, 1977
66.801
+0.167
0.25%
jan 1, 1978
67.195
+0.394
0.59%
jan 1, 1979
66.95
-0.245
-0.36%
jan 1, 1980
66.81
-0.14
-0.21%
jan 1, 1981
67.083
+0.273
0.41%
jan 1, 1982
67.281
+0.198
0.29%
jan 1, 1983
67.161
-0.12
-0.18%
jan 1, 1984
67.347
+0.187
0.28%
jan 1, 1985
68.062
+0.715
1.06%
jan 1, 1986
68.694
+0.632
0.93%
jan 1, 1987
70.071
+1.377
2.01%
jan 1, 1988
69.998
-0.074
-0.1%
jan 1, 1989
70.253
+0.256
0.37%
jan 1, 1990
70.674
+0.421
0.6%
jan 1, 1991
70.255
-0.419
-0.59%
jan 1, 1992
71.062
+0.807
1.15%
jan 1, 1993
71.132
+0.07
0.1%
jan 1, 1994
71.736
+0.603
0.85%
jan 1, 1995
71.481
-0.255
-0.36%
jan 1, 1996
70.378
-1.103
-1.54%
jan 1, 1997
70.692
+0.314
0.45%
jan 1, 1998
72.287
+1.595
2.26%
jan 1, 1999
74.075
+1.788
2.47%
jan 1, 2000
75.121
+1.046
1.41%
jan 1, 2001
75.063
-0.058
-0.08%
jan 1, 2002
76.53
+1.467
1.95%
jan 1, 2003
75.371
-1.159
-1.51%
jan 1, 2004
74.1
-1.271
-1.69%
jan 1, 2005
73.332
-0.768
-1.04%
jan 1, 2006
72.372
-0.96
-1.31%
jan 1, 2007
72.523
+0.151
0.21%
jan 1, 2008
72.69
+0.167
0.23%
jan 1, 2009
74.203
+1.513
2.08%
jan 1, 2010
73.764
-0.439
-0.59%
jan 1, 2011
73.432
-0.332
-0.45%
jan 1, 2012
73.127
-0.305
-0.42%
jan 1, 2013
71.691
-1.436
-1.96%
jan 1, 2014
71.385
-0.306
-0.43%
Ranking of countries by current statistics by years


Comments: