29
/
en
AIzaSyAYiBZKx7MnpbEhh9jyipgxe19OcubqV5w
April 1, 2024
236516
Senegal
SEN
true
2
1
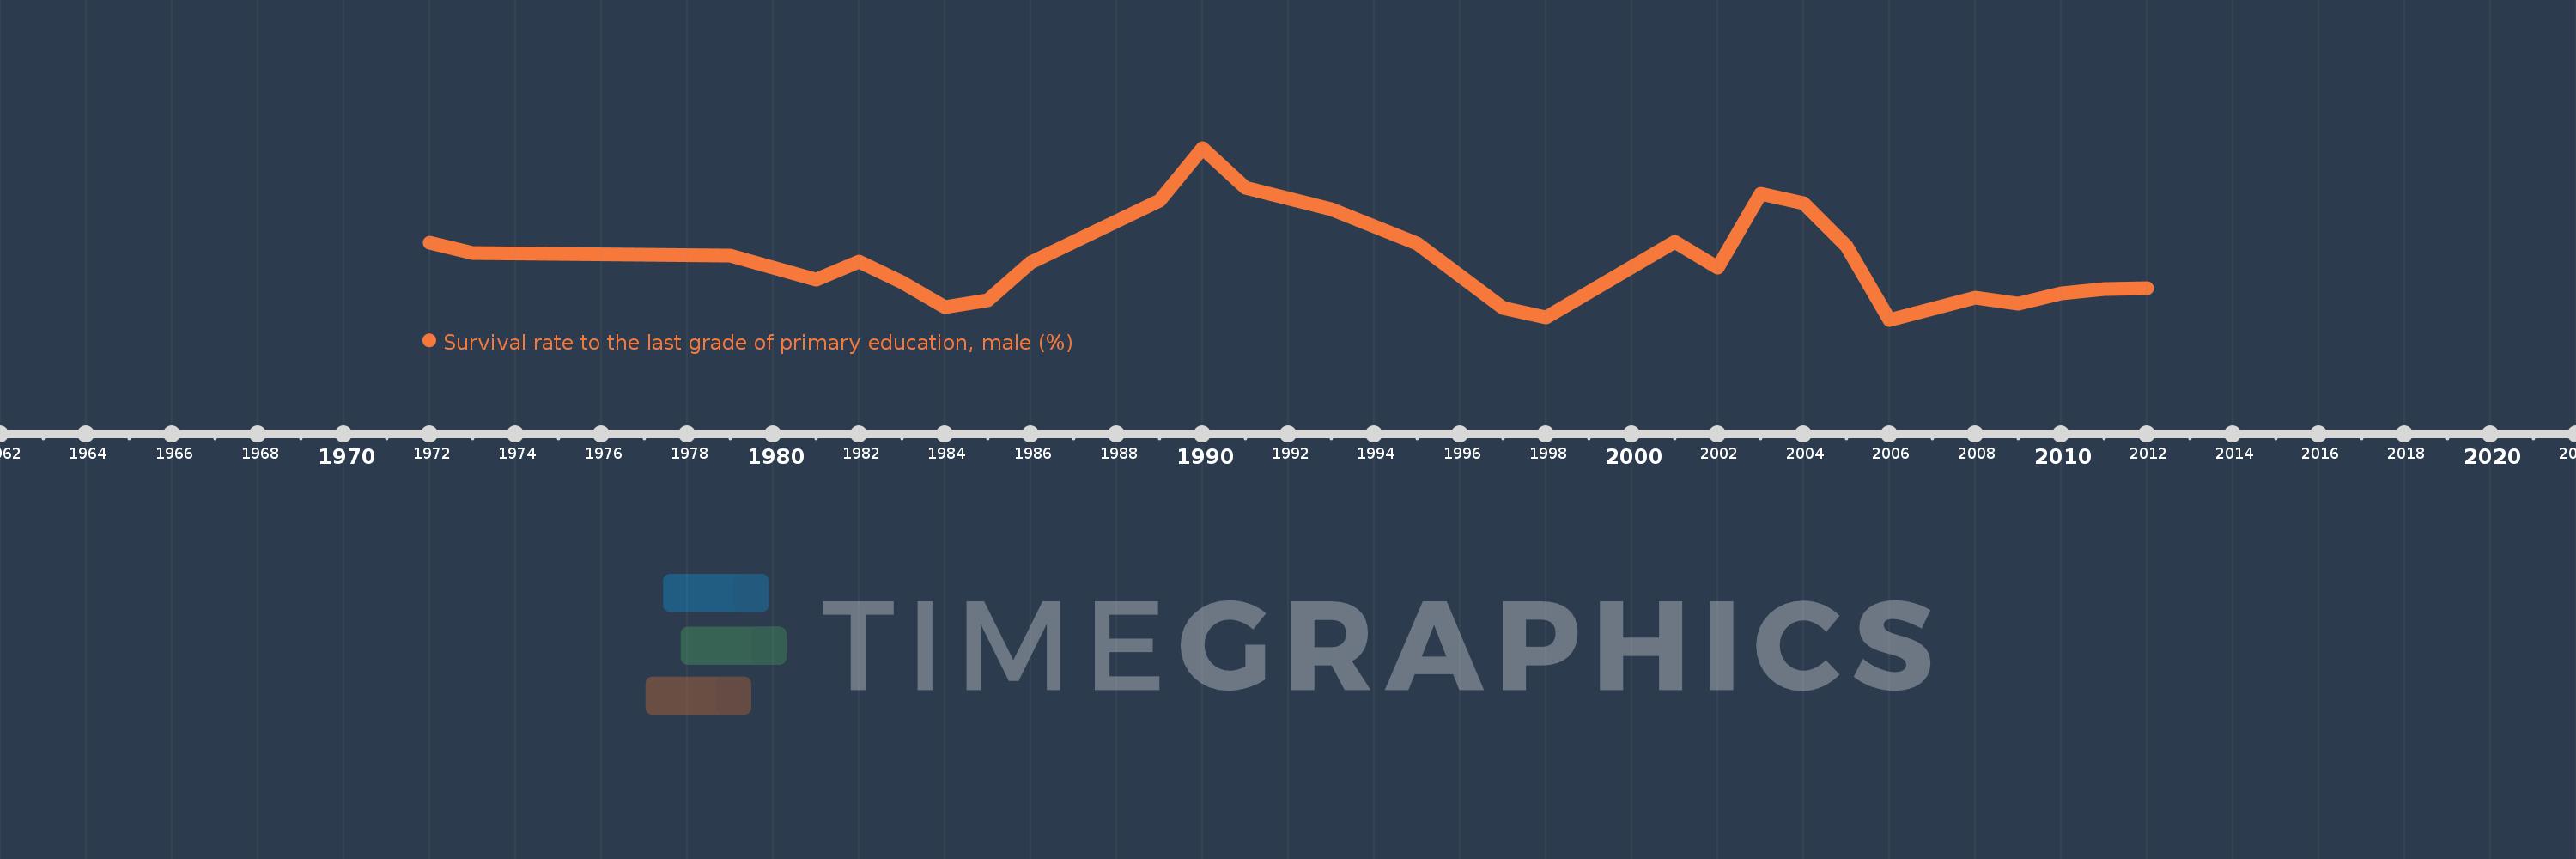
Survival rate to the last grade of primary education, male (%)
2012,2011,2010,2009,2008,2006,2005,2004,2003,2002,2001,1998,1997,1995,1993,1991,1990,1989,1986,1985,1984,1983,1982,1981,1979,1973,1972
This statistics in other country:
AfghanistanAlbaniaAlgeriaAndorraAngolaArab WorldArgentinaArmeniaArubaAustriaAzerbaijanBahamas, TheBahrainBangladeshBarbadosBelarusBelgiumBelizeBeninBermudaBhutanBoliviaBosnia and HerzegovinaBotswanaBrazilBrunei DarussalamBulgariaBurkina FasoBurundiCabo VerdeCambodiaCameroonCanadaCaribbean small statesCentral African RepublicCentral Europe and the BalticsChadChileChinaColombiaComorosCongo, Dem. Rep.Congo, Rep.Costa RicaCote d'IvoireCroatiaCubaCyprusCzech RepublicDenmarkDjiboutiDominicaDominican RepublicEarly-demographic dividendEast Asia & PacificEast Asia & Pacific (excluding high income)East Asia & Pacific (IDA & IBRD countries)EcuadorEgypt, Arab Rep.El SalvadorEquatorial GuineaEritreaEstoniaEthiopiaEuro areaEurope & Central AsiaEurope & Central Asia (excluding high income)Europe & Central Asia (IDA & IBRD countries)European UnionFijiFinlandFragile and conflict affected situationsFranceGabonGambia, TheGeorgiaGermanyGhanaGreeceGuatemalaGuineaGuinea-BissauGuyanaHaitiHeavily indebted poor countries (HIPC)High incomeHondurasHong Kong SAR, ChinaHungaryIBRD onlyIcelandIDA & IBRD totalIDA blendIDA onlyIDA totalIndiaIndonesiaIran, Islamic Rep.IraqIsraelItalyJamaicaJapanJordanKazakhstanKenyaKiribatiKorea, Rep.KuwaitKyrgyz RepublicLao PDRLate-demographic dividendLatin America & Caribbean Latin America & Caribbean (excluding high income)Latin America & the Caribbean (IDA & IBRD countries)LatviaLeast developed countries: UN classificationLebanonLesothoLiberiaLibyaLiechtensteinLithuaniaLow & middle incomeLow incomeLower middle incomeLuxembourgMacao SAR, ChinaMacedonia, FYRMadagascarMalawiMalaysiaMaldivesMaliMaltaMarshall IslandsMauritaniaMauritiusMexicoMiddle East & North AfricaMiddle East & North Africa (excluding high income)Middle East & North Africa (IDA & IBRD countries)Middle incomeMoldovaMongoliaMontenegroMoroccoMozambiqueMyanmarNamibiaNepalNetherlandsNicaraguaNigerNigeriaNorth AmericaNorwayOECD membersOmanOther small statesPacific island small statesPakistanPanamaPapua New GuineaParaguayPeruPhilippinesPolandPortugalPost-demographic dividendPre-demographic dividendQatarRomaniaRussian FederationRwandaSamoaSan MarinoSao Tome and PrincipeSaudi ArabiaSenegalSerbiaSeychellesSierra LeoneSingaporeSlovak RepublicSloveniaSmall statesSolomon IslandsSouth AfricaSouth AsiaSouth Asia (IDA & IBRD)SpainSri LankaSt. Kitts and NevisSt. LuciaSt. Vincent and the GrenadinesSub-Saharan Africa Sub-Saharan Africa (excluding high income)Sub-Saharan Africa (IDA & IBRD countries)SudanSurinameSwazilandSwedenSwitzerlandSyrian Arab RepublicTajikistanTanzaniaThailandTimor-LesteTogoTongaTrinidad and TobagoTunisiaTurkeyUgandaUkraineUnited Arab EmiratesUpper middle incomeUruguayUzbekistanVanuatuVenezuela, RBVietnamWest Bank and GazaWorldYemen, Rep.ZambiaZimbabwe Timeline:
This timeline shows a graph from 1972 to 2012 of Senegal. No data until 1971. Number of actual observations by date: 27.
Source name:
World Development Indicators
Source organization:
UNESCO Institute for Statistics
Categories, topics:
Education, Gender
Last updated:
apr 23, 2017
Indicators value changes by year
Minimum:
53.805
jan 1, 2006
Maximum:
81.889
jan 1, 1990
At the date of observation
Value
Absolute change
Change from previous value
jan 1, 1972
66.341
+66.341
0.0%
jan 1, 1973
64.735
-1.606
-2.42%
jan 1, 1979
64.278
-0.457
-0.71%
jan 1, 1981
60.402
-3.876
-6.03%
jan 1, 1982
63.376
+2.975
4.92%
jan 1, 1983
59.882
-3.494
-5.51%
jan 1, 1984
55.913
-3.969
-6.63%
jan 1, 1985
57.03
+1.117
2.0%
jan 1, 1986
63.157
+6.127
10.74%
jan 1, 1989
73.328
+10.17
16.1%
jan 1, 1990
81.889
+8.561
11.67%
jan 1, 1991
75.445
-6.443
-7.87%
jan 1, 1993
71.93
-3.516
-4.66%
jan 1, 1995
66.265
-5.665
-7.88%
jan 1, 1997
55.781
-10.484
-15.82%
jan 1, 1998
54.17
-1.611
-2.89%
jan 1, 2001
66.506
+12.336
22.77%
jan 1, 2002
62.397
-4.109
-6.18%
jan 1, 2003
74.345
+11.948
19.15%
jan 1, 2004
72.929
-1.416
-1.9%
jan 1, 2005
65.85
-7.079
-9.71%
jan 1, 2006
53.805
-12.045
-18.29%
jan 1, 2008
57.368
+3.563
6.62%
jan 1, 2009
56.416
-0.952
-1.66%
jan 1, 2010
58.085
+1.669
2.96%
jan 1, 2011
58.8
+0.715
1.23%
jan 1, 2012
58.97
+0.171
0.29%
Ranking of countries by current statistics by years


Comments: