29
/
en
AIzaSyAYiBZKx7MnpbEhh9jyipgxe19OcubqV5w
April 1, 2024
53823
Other small states
OSS
false
2
1
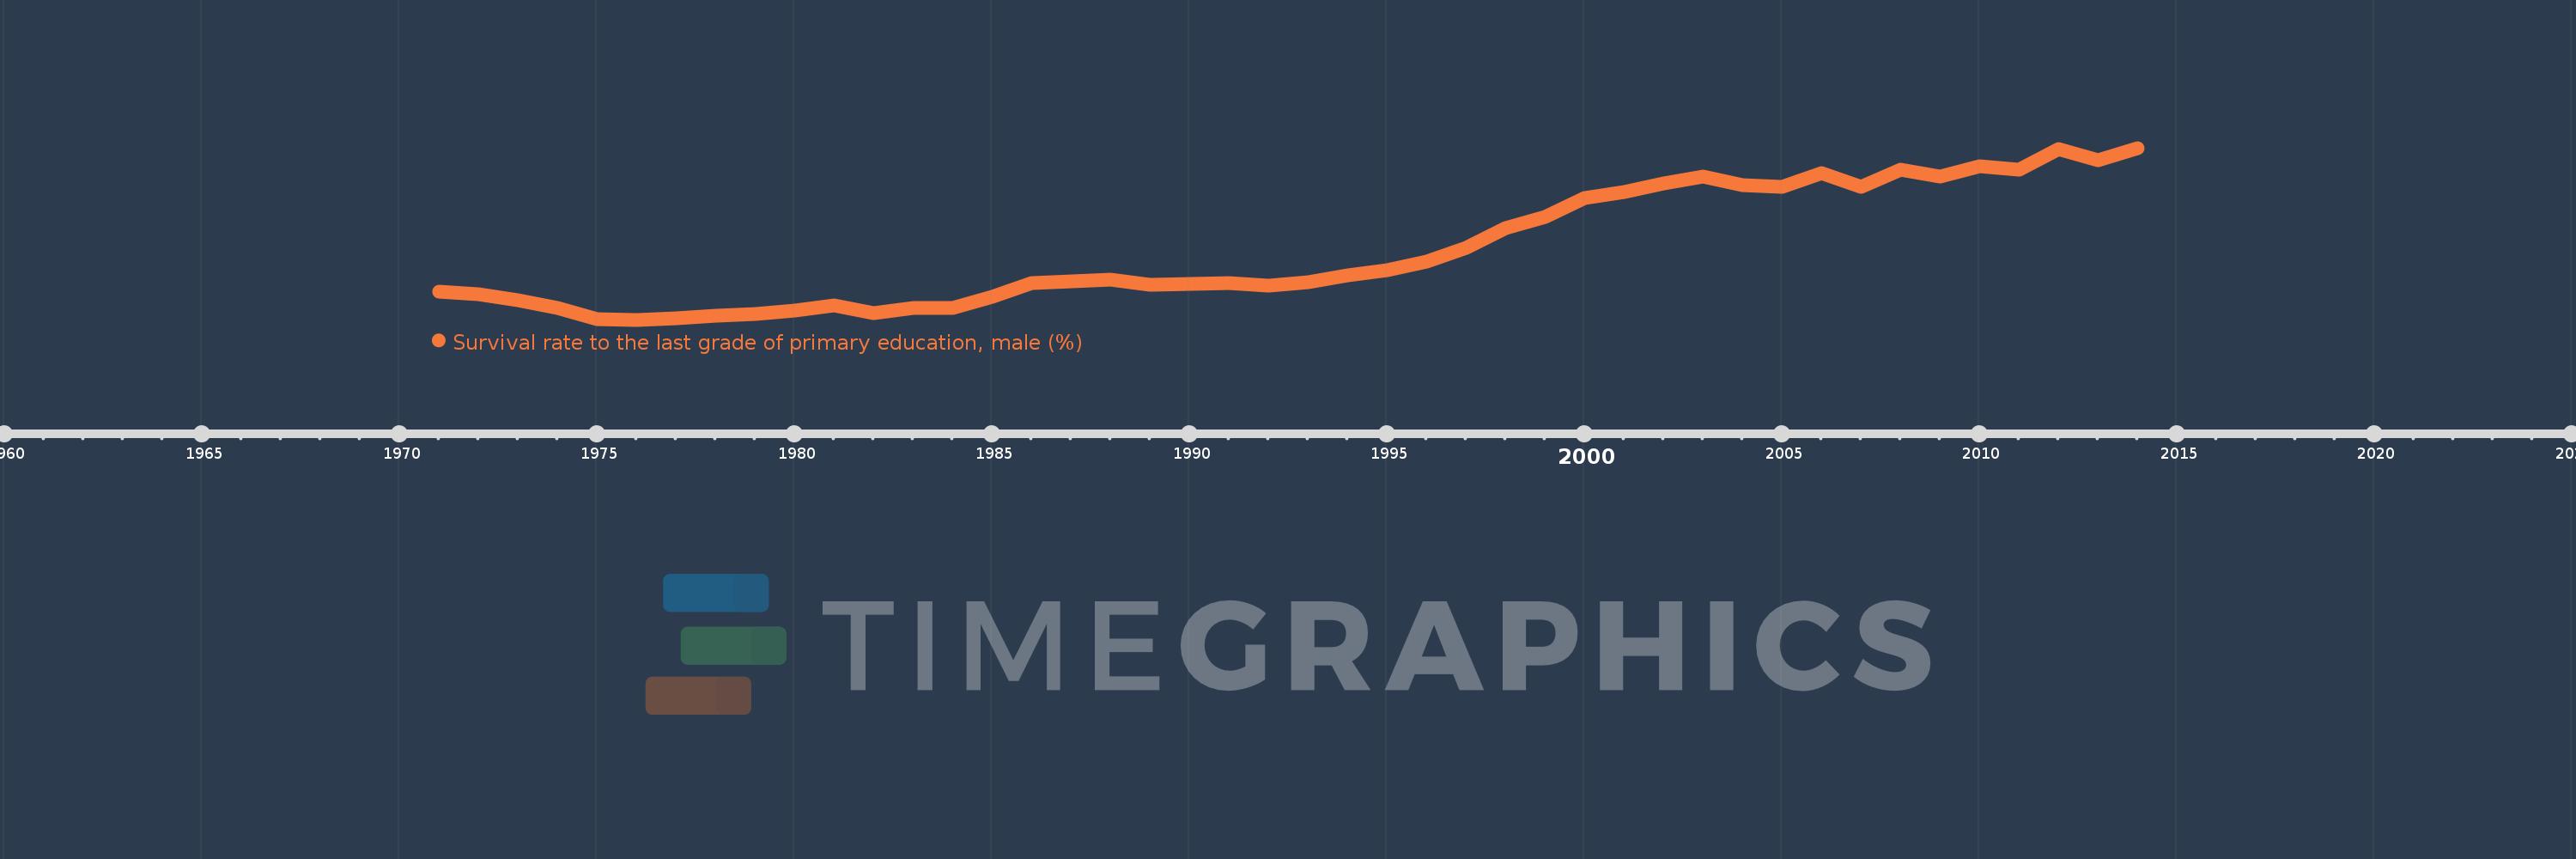
Survival rate to the last grade of primary education, male (%)
2014,2013,2012,2011,2010,2009,2008,2007,2006,2005,2004,2003,2002,2001,2000,1999,1998,1997,1996,1995,1994,1993,1992,1991,1990,1989,1988,1987,1986,1985,1984,1983,1982,1981,1980,1979,1978,1977,1976,1975,1974,1973,1972,1971
This statistics in other country:
AfghanistanAlbaniaAlgeriaAndorraAngolaArab WorldArgentinaArmeniaArubaAustriaAzerbaijanBahamas, TheBahrainBangladeshBarbadosBelarusBelgiumBelizeBeninBermudaBhutanBoliviaBosnia and HerzegovinaBotswanaBrazilBrunei DarussalamBulgariaBurkina FasoBurundiCabo VerdeCambodiaCameroonCanadaCaribbean small statesCentral African RepublicCentral Europe and the BalticsChadChileChinaColombiaComorosCongo, Dem. Rep.Congo, Rep.Costa RicaCote d'IvoireCroatiaCubaCyprusCzech RepublicDenmarkDjiboutiDominicaDominican RepublicEarly-demographic dividendEast Asia & PacificEast Asia & Pacific (excluding high income)East Asia & Pacific (IDA & IBRD countries)EcuadorEgypt, Arab Rep.El SalvadorEquatorial GuineaEritreaEstoniaEthiopiaEuro areaEurope & Central AsiaEurope & Central Asia (excluding high income)Europe & Central Asia (IDA & IBRD countries)European UnionFijiFinlandFragile and conflict affected situationsFranceGabonGambia, TheGeorgiaGermanyGhanaGreeceGuatemalaGuineaGuinea-BissauGuyanaHaitiHeavily indebted poor countries (HIPC)High incomeHondurasHong Kong SAR, ChinaHungaryIBRD onlyIcelandIDA & IBRD totalIDA blendIDA onlyIDA totalIndiaIndonesiaIran, Islamic Rep.IraqIsraelItalyJamaicaJapanJordanKazakhstanKenyaKiribatiKorea, Rep.KuwaitKyrgyz RepublicLao PDRLate-demographic dividendLatin America & Caribbean Latin America & Caribbean (excluding high income)Latin America & the Caribbean (IDA & IBRD countries)LatviaLeast developed countries: UN classificationLebanonLesothoLiberiaLibyaLiechtensteinLithuaniaLow & middle incomeLow incomeLower middle incomeLuxembourgMacao SAR, ChinaMacedonia, FYRMadagascarMalawiMalaysiaMaldivesMaliMaltaMarshall IslandsMauritaniaMauritiusMexicoMiddle East & North AfricaMiddle East & North Africa (excluding high income)Middle East & North Africa (IDA & IBRD countries)Middle incomeMoldovaMongoliaMontenegroMoroccoMozambiqueMyanmarNamibiaNepalNetherlandsNicaraguaNigerNigeriaNorth AmericaNorwayOECD membersOmanOther small statesPacific island small statesPakistanPanamaPapua New GuineaParaguayPeruPhilippinesPolandPortugalPost-demographic dividendPre-demographic dividendQatarRomaniaRussian FederationRwandaSamoaSan MarinoSao Tome and PrincipeSaudi ArabiaSenegalSerbiaSeychellesSierra LeoneSingaporeSlovak RepublicSloveniaSmall statesSolomon IslandsSouth AfricaSouth AsiaSouth Asia (IDA & IBRD)SpainSri LankaSt. Kitts and NevisSt. LuciaSt. Vincent and the GrenadinesSub-Saharan Africa Sub-Saharan Africa (excluding high income)Sub-Saharan Africa (IDA & IBRD countries)SudanSurinameSwazilandSwedenSwitzerlandSyrian Arab RepublicTajikistanTanzaniaThailandTimor-LesteTogoTongaTrinidad and TobagoTunisiaTurkeyUgandaUkraineUnited Arab EmiratesUpper middle incomeUruguayUzbekistanVanuatuVenezuela, RBVietnamWest Bank and GazaWorldYemen, Rep.ZambiaZimbabwe Timeline:
This timeline shows a graph from 1971 to 2014 of Other small states. No data until 1970. Number of actual observations by date: 44.
Source name:
World Development Indicators
Source organization:
UNESCO Institute for Statistics
Categories, topics:
Education, Gender
Last updated:
apr 23, 2017
Indicators value changes by year
Minimum:
48.809
jan 1, 1976
Maximum:
70.748
jan 1, 2014
At the date of observation
Value
Absolute change
Change from previous value
jan 1, 1971
52.447
+52.447
0.0%
jan 1, 1972
52.113
-0.333
-0.64%
jan 1, 1973
51.314
-0.799
-1.53%
jan 1, 1974
50.336
-0.979
-1.91%
jan 1, 1975
48.913
-1.423
-2.83%
jan 1, 1976
48.809
-0.104
-0.21%
jan 1, 1977
48.98
+0.171
0.35%
jan 1, 1978
49.345
+0.365
0.75%
jan 1, 1979
49.507
+0.162
0.33%
jan 1, 1980
49.967
+0.46
0.93%
jan 1, 1981
50.653
+0.686
1.37%
jan 1, 1982
49.634
-1.018
-2.01%
jan 1, 1983
50.342
+0.708
1.43%
jan 1, 1984
50.364
+0.022
0.04%
jan 1, 1985
51.766
+1.402
2.78%
jan 1, 1986
53.454
+1.688
3.26%
jan 1, 1987
53.658
+0.204
0.38%
jan 1, 1988
53.879
+0.221
0.41%
jan 1, 1989
53.325
-0.554
-1.03%
jan 1, 1990
53.42
+0.095
0.18%
jan 1, 1991
53.49
+0.07
0.13%
jan 1, 1992
53.118
-0.372
-0.69%
jan 1, 1993
53.633
+0.516
0.97%
jan 1, 1994
54.459
+0.826
1.54%
jan 1, 1995
55.091
+0.632
1.16%
jan 1, 1996
56.187
+1.095
1.99%
jan 1, 1997
57.94
+1.753
3.12%
jan 1, 1998
60.491
+2.551
4.4%
jan 1, 1999
61.941
+1.451
2.4%
jan 1, 2000
64.312
+2.371
3.83%
jan 1, 2001
65.106
+0.794
1.23%
jan 1, 2002
66.219
+1.113
1.71%
jan 1, 2003
67.134
+0.916
1.38%
jan 1, 2004
65.944
-1.19
-1.77%
jan 1, 2005
65.748
-0.196
-0.3%
jan 1, 2006
67.498
+1.75
2.66%
jan 1, 2007
65.831
-1.667
-2.47%
jan 1, 2008
67.958
+2.127
3.23%
jan 1, 2009
67.082
-0.876
-1.29%
jan 1, 2010
68.449
+1.367
2.04%
jan 1, 2011
67.968
-0.481
-0.7%
jan 1, 2012
70.573
+2.605
3.83%
jan 1, 2013
69.219
-1.354
-1.92%
jan 1, 2014
70.748
+1.528
2.21%
Ranking of countries by current statistics by years


Comments: