29
/
en
AIzaSyAYiBZKx7MnpbEhh9jyipgxe19OcubqV5w
April 1, 2024
26938
Early-demographic dividend
EAR
false
2
1
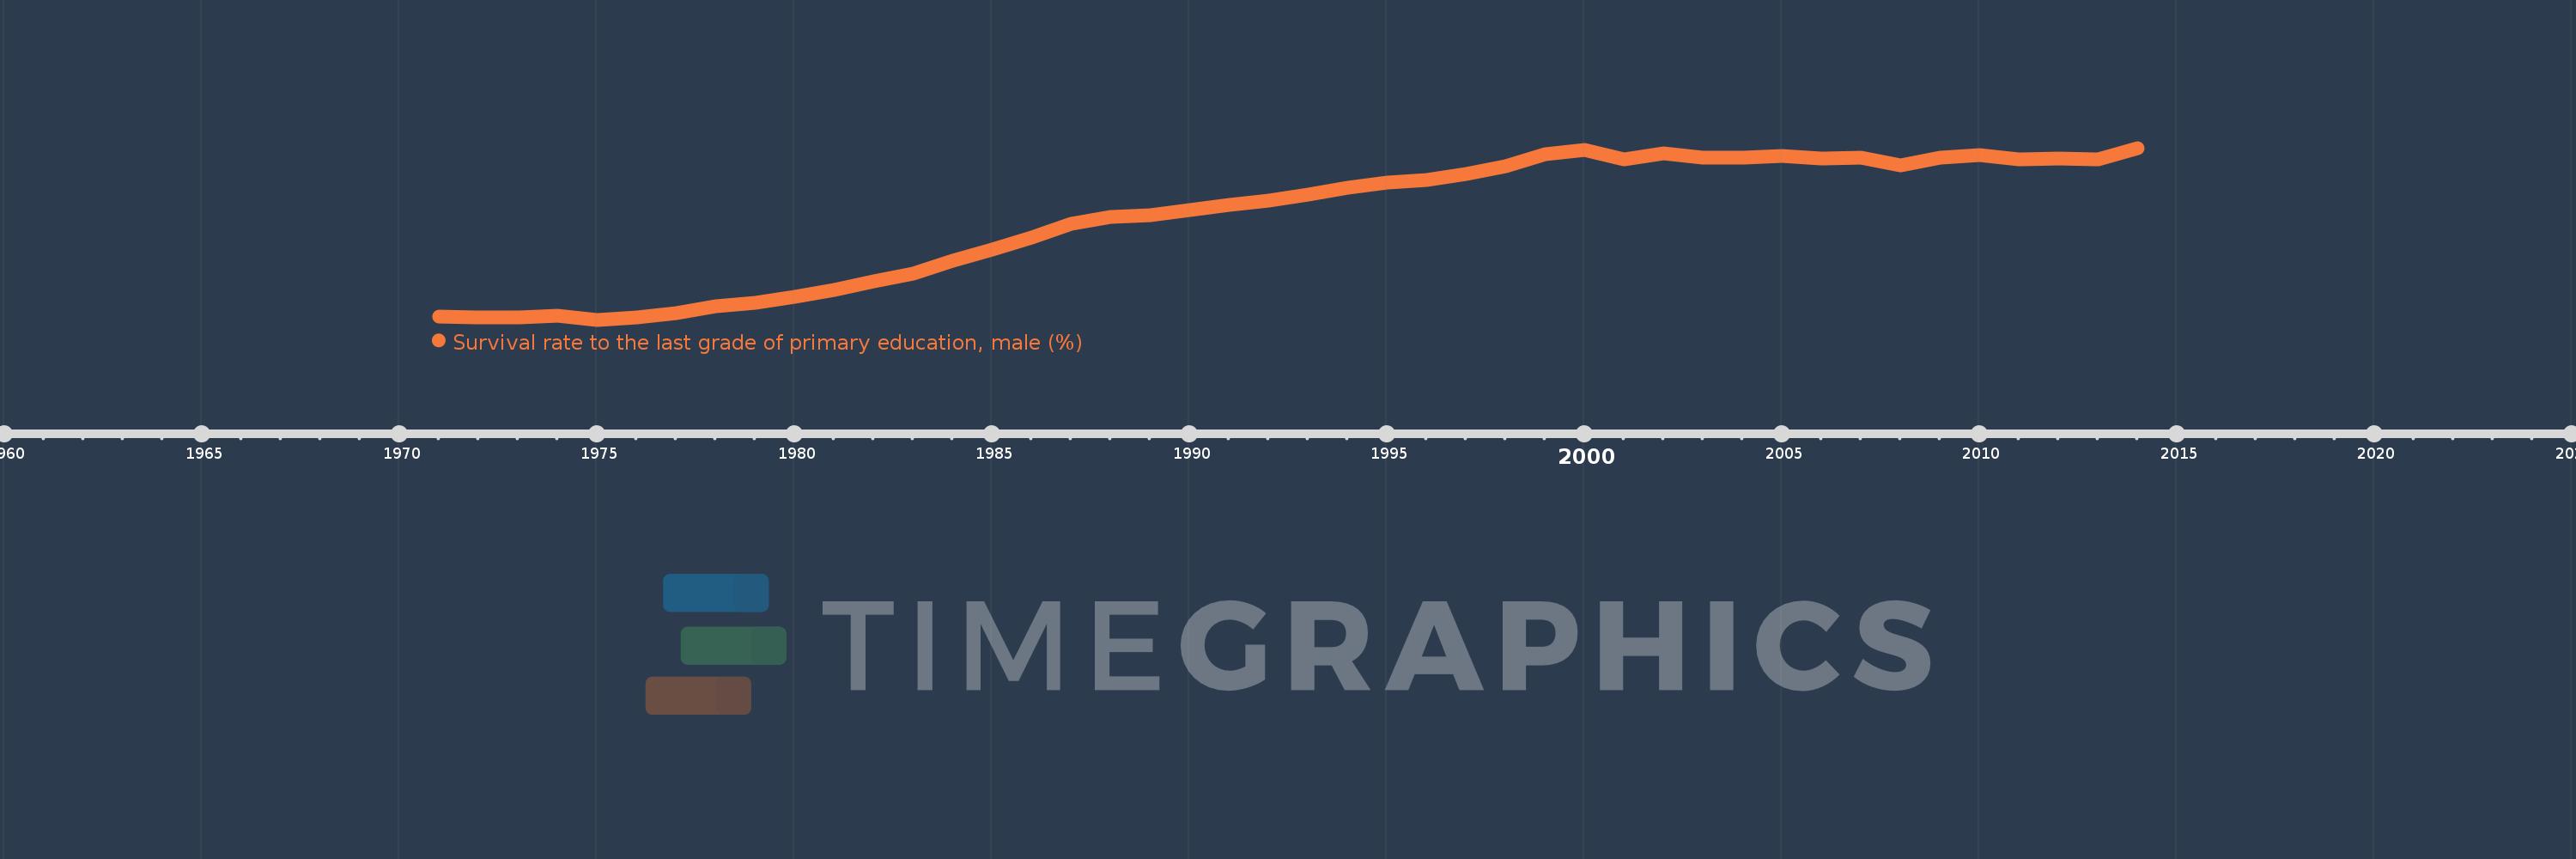
Survival rate to the last grade of primary education, male (%)
2014,2013,2012,2011,2010,2009,2008,2007,2006,2005,2004,2003,2002,2001,2000,1999,1998,1997,1996,1995,1994,1993,1992,1991,1990,1989,1988,1987,1986,1985,1984,1983,1982,1981,1980,1979,1978,1977,1976,1975,1974,1973,1972,1971
This statistics in other country:
AfghanistanAlbaniaAlgeriaAndorraAngolaArab WorldArgentinaArmeniaArubaAustriaAzerbaijanBahamas, TheBahrainBangladeshBarbadosBelarusBelgiumBelizeBeninBermudaBhutanBoliviaBosnia and HerzegovinaBotswanaBrazilBrunei DarussalamBulgariaBurkina FasoBurundiCabo VerdeCambodiaCameroonCanadaCaribbean small statesCentral African RepublicCentral Europe and the BalticsChadChileChinaColombiaComorosCongo, Dem. Rep.Congo, Rep.Costa RicaCote d'IvoireCroatiaCubaCyprusCzech RepublicDenmarkDjiboutiDominicaDominican RepublicEarly-demographic dividendEast Asia & PacificEast Asia & Pacific (excluding high income)East Asia & Pacific (IDA & IBRD countries)EcuadorEgypt, Arab Rep.El SalvadorEquatorial GuineaEritreaEstoniaEthiopiaEuro areaEurope & Central AsiaEurope & Central Asia (excluding high income)Europe & Central Asia (IDA & IBRD countries)European UnionFijiFinlandFragile and conflict affected situationsFranceGabonGambia, TheGeorgiaGermanyGhanaGreeceGuatemalaGuineaGuinea-BissauGuyanaHaitiHeavily indebted poor countries (HIPC)High incomeHondurasHong Kong SAR, ChinaHungaryIBRD onlyIcelandIDA & IBRD totalIDA blendIDA onlyIDA totalIndiaIndonesiaIran, Islamic Rep.IraqIsraelItalyJamaicaJapanJordanKazakhstanKenyaKiribatiKorea, Rep.KuwaitKyrgyz RepublicLao PDRLate-demographic dividendLatin America & Caribbean Latin America & Caribbean (excluding high income)Latin America & the Caribbean (IDA & IBRD countries)LatviaLeast developed countries: UN classificationLebanonLesothoLiberiaLibyaLiechtensteinLithuaniaLow & middle incomeLow incomeLower middle incomeLuxembourgMacao SAR, ChinaMacedonia, FYRMadagascarMalawiMalaysiaMaldivesMaliMaltaMarshall IslandsMauritaniaMauritiusMexicoMiddle East & North AfricaMiddle East & North Africa (excluding high income)Middle East & North Africa (IDA & IBRD countries)Middle incomeMoldovaMongoliaMontenegroMoroccoMozambiqueMyanmarNamibiaNepalNetherlandsNicaraguaNigerNigeriaNorth AmericaNorwayOECD membersOmanOther small statesPacific island small statesPakistanPanamaPapua New GuineaParaguayPeruPhilippinesPolandPortugalPost-demographic dividendPre-demographic dividendQatarRomaniaRussian FederationRwandaSamoaSan MarinoSao Tome and PrincipeSaudi ArabiaSenegalSerbiaSeychellesSierra LeoneSingaporeSlovak RepublicSloveniaSmall statesSolomon IslandsSouth AfricaSouth AsiaSouth Asia (IDA & IBRD)SpainSri LankaSt. Kitts and NevisSt. LuciaSt. Vincent and the GrenadinesSub-Saharan Africa Sub-Saharan Africa (excluding high income)Sub-Saharan Africa (IDA & IBRD countries)SudanSurinameSwazilandSwedenSwitzerlandSyrian Arab RepublicTajikistanTanzaniaThailandTimor-LesteTogoTongaTrinidad and TobagoTunisiaTurkeyUgandaUkraineUnited Arab EmiratesUpper middle incomeUruguayUzbekistanVanuatuVenezuela, RBVietnamWest Bank and GazaWorldYemen, Rep.ZambiaZimbabwe Timeline:
This timeline shows a graph from 1971 to 2014 of Early-demographic dividend. No data until 1970. Number of actual observations by date: 44.
Source name:
World Development Indicators
Source organization:
UNESCO Institute for Statistics
Categories, topics:
Education, Gender
Last updated:
apr 23, 2017
Indicators value changes by year
Minimum:
45.211
jan 1, 1975
Maximum:
68.863
jan 1, 2014
At the date of observation
Value
Absolute change
Change from previous value
jan 1, 1971
45.65
+45.65
0.0%
jan 1, 1972
45.524
-0.125
-0.27%
jan 1, 1973
45.494
-0.031
-0.07%
jan 1, 1974
45.817
+0.324
0.71%
jan 1, 1975
45.211
-0.606
-1.32%
jan 1, 1976
45.543
+0.332
0.73%
jan 1, 1977
46.17
+0.626
1.37%
jan 1, 1978
47.056
+0.887
1.92%
jan 1, 1979
47.594
+0.538
1.14%
jan 1, 1980
48.427
+0.833
1.75%
jan 1, 1981
49.343
+0.916
1.89%
jan 1, 1982
50.515
+1.172
2.38%
jan 1, 1983
51.513
+0.998
1.98%
jan 1, 1984
53.354
+1.841
3.57%
jan 1, 1985
54.847
+1.493
2.8%
jan 1, 1986
56.542
+1.695
3.09%
jan 1, 1987
58.402
+1.86
3.29%
jan 1, 1988
59.424
+1.022
1.75%
jan 1, 1989
59.578
+0.154
0.26%
jan 1, 1990
60.36
+0.781
1.31%
jan 1, 1991
61.011
+0.651
1.08%
jan 1, 1992
61.609
+0.598
0.98%
jan 1, 1993
62.409
+0.8
1.3%
jan 1, 1994
63.361
+0.952
1.53%
jan 1, 1995
64.081
+0.72
1.14%
jan 1, 1996
64.502
+0.421
0.66%
jan 1, 1997
65.338
+0.836
1.3%
jan 1, 1998
66.349
+1.011
1.55%
jan 1, 1999
67.96
+1.61
2.43%
jan 1, 2000
68.621
+0.661
0.97%
jan 1, 2001
67.236
-1.385
-2.02%
jan 1, 2002
68.092
+0.856
1.27%
jan 1, 2003
67.551
-0.541
-0.8%
jan 1, 2004
67.564
+0.013
0.02%
jan 1, 2005
67.705
+0.141
0.21%
jan 1, 2006
67.431
-0.274
-0.4%
jan 1, 2007
67.573
+0.142
0.21%
jan 1, 2008
66.515
-1.058
-1.57%
jan 1, 2009
67.556
+1.042
1.57%
jan 1, 2010
67.904
+0.347
0.51%
jan 1, 2011
67.248
-0.655
-0.96%
jan 1, 2012
67.403
+0.155
0.23%
jan 1, 2013
67.34
-0.063
-0.09%
jan 1, 2014
68.863
+1.523
2.26%
Ranking of countries by current statistics by years


Comments: