29
/
en
AIzaSyAYiBZKx7MnpbEhh9jyipgxe19OcubqV5w
April 1, 2024
60406
Sub-Saharan Africa (excluding high income)
SSA
false
2
1
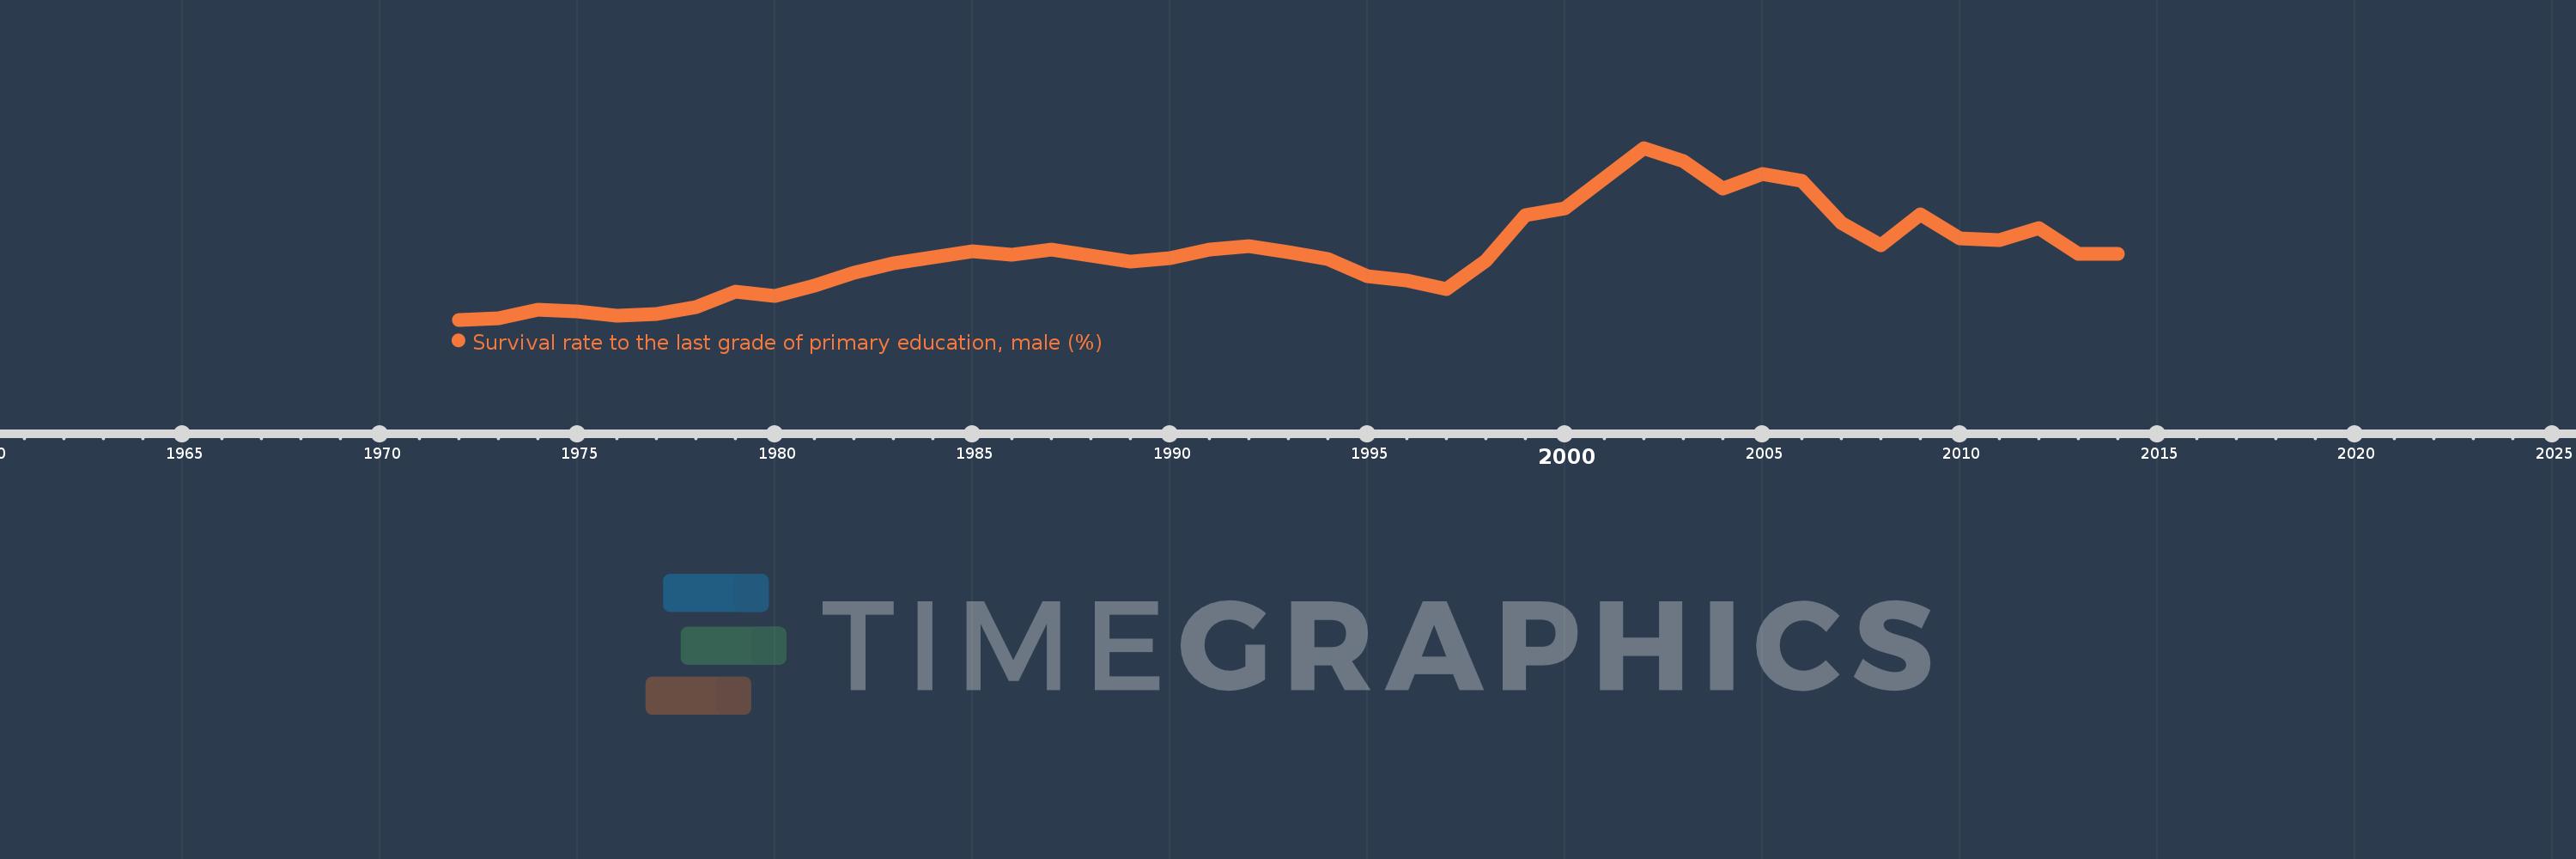
Survival rate to the last grade of primary education, male (%)
2014,2013,2012,2011,2010,2009,2008,2007,2006,2005,2004,2003,2002,2001,2000,1999,1998,1997,1996,1995,1994,1993,1992,1991,1990,1989,1988,1987,1986,1985,1984,1983,1982,1981,1980,1979,1978,1977,1976,1975,1974,1973,1972
This statistics in other country:
AfghanistanAlbaniaAlgeriaAndorraAngolaArab WorldArgentinaArmeniaArubaAustriaAzerbaijanBahamas, TheBahrainBangladeshBarbadosBelarusBelgiumBelizeBeninBermudaBhutanBoliviaBosnia and HerzegovinaBotswanaBrazilBrunei DarussalamBulgariaBurkina FasoBurundiCabo VerdeCambodiaCameroonCanadaCaribbean small statesCentral African RepublicCentral Europe and the BalticsChadChileChinaColombiaComorosCongo, Dem. Rep.Congo, Rep.Costa RicaCote d'IvoireCroatiaCubaCyprusCzech RepublicDenmarkDjiboutiDominicaDominican RepublicEarly-demographic dividendEast Asia & PacificEast Asia & Pacific (excluding high income)East Asia & Pacific (IDA & IBRD countries)EcuadorEgypt, Arab Rep.El SalvadorEquatorial GuineaEritreaEstoniaEthiopiaEuro areaEurope & Central AsiaEurope & Central Asia (excluding high income)Europe & Central Asia (IDA & IBRD countries)European UnionFijiFinlandFragile and conflict affected situationsFranceGabonGambia, TheGeorgiaGermanyGhanaGreeceGuatemalaGuineaGuinea-BissauGuyanaHaitiHeavily indebted poor countries (HIPC)High incomeHondurasHong Kong SAR, ChinaHungaryIBRD onlyIcelandIDA & IBRD totalIDA blendIDA onlyIDA totalIndiaIndonesiaIran, Islamic Rep.IraqIsraelItalyJamaicaJapanJordanKazakhstanKenyaKiribatiKorea, Rep.KuwaitKyrgyz RepublicLao PDRLate-demographic dividendLatin America & Caribbean Latin America & Caribbean (excluding high income)Latin America & the Caribbean (IDA & IBRD countries)LatviaLeast developed countries: UN classificationLebanonLesothoLiberiaLibyaLiechtensteinLithuaniaLow & middle incomeLow incomeLower middle incomeLuxembourgMacao SAR, ChinaMacedonia, FYRMadagascarMalawiMalaysiaMaldivesMaliMaltaMarshall IslandsMauritaniaMauritiusMexicoMiddle East & North AfricaMiddle East & North Africa (excluding high income)Middle East & North Africa (IDA & IBRD countries)Middle incomeMoldovaMongoliaMontenegroMoroccoMozambiqueMyanmarNamibiaNepalNetherlandsNicaraguaNigerNigeriaNorth AmericaNorwayOECD membersOmanOther small statesPacific island small statesPakistanPanamaPapua New GuineaParaguayPeruPhilippinesPolandPortugalPost-demographic dividendPre-demographic dividendQatarRomaniaRussian FederationRwandaSamoaSan MarinoSao Tome and PrincipeSaudi ArabiaSenegalSerbiaSeychellesSierra LeoneSingaporeSlovak RepublicSloveniaSmall statesSolomon IslandsSouth AfricaSouth AsiaSouth Asia (IDA & IBRD)SpainSri LankaSt. Kitts and NevisSt. LuciaSt. Vincent and the GrenadinesSub-Saharan Africa Sub-Saharan Africa (excluding high income)Sub-Saharan Africa (IDA & IBRD countries)SudanSurinameSwazilandSwedenSwitzerlandSyrian Arab RepublicTajikistanTanzaniaThailandTimor-LesteTogoTongaTrinidad and TobagoTunisiaTurkeyUgandaUkraineUnited Arab EmiratesUpper middle incomeUruguayUzbekistanVanuatuVenezuela, RBVietnamWest Bank and GazaWorldYemen, Rep.ZambiaZimbabwe Timeline:
This timeline shows a graph from 1972 to 2014 of Sub-Saharan Africa (excluding high income). No data until 1971. Number of actual observations by date: 43.
Source name:
World Development Indicators
Source organization:
UNESCO Institute for Statistics
Categories, topics:
Education, Gender
Last updated:
apr 23, 2017
Indicators value changes by year
Minimum:
50.757
jan 1, 1972
Maximum:
64.913
jan 1, 2002
At the date of observation
Value
Absolute change
Change from previous value
jan 1, 1972
50.757
+50.757
0.0%
jan 1, 1973
50.898
+0.142
0.28%
jan 1, 1974
51.592
+0.694
1.36%
jan 1, 1975
51.422
-0.171
-0.33%
jan 1, 1976
51.059
-0.362
-0.7%
jan 1, 1977
51.253
+0.194
0.38%
jan 1, 1978
51.82
+0.567
1.11%
jan 1, 1979
53.099
+1.279
2.47%
jan 1, 1980
52.713
-0.386
-0.73%
jan 1, 1981
53.536
+0.824
1.56%
jan 1, 1982
54.635
+1.099
2.05%
jan 1, 1983
55.437
+0.801
1.47%
jan 1, 1984
55.873
+0.436
0.79%
jan 1, 1985
56.426
+0.552
0.99%
jan 1, 1986
56.12
-0.306
-0.54%
jan 1, 1987
56.528
+0.408
0.73%
jan 1, 1988
56.06
-0.468
-0.83%
jan 1, 1989
55.532
-0.527
-0.94%
jan 1, 1990
55.847
+0.314
0.57%
jan 1, 1991
56.539
+0.692
1.24%
jan 1, 1992
56.836
+0.297
0.52%
jan 1, 1993
56.342
-0.493
-0.87%
jan 1, 1994
55.764
-0.579
-1.03%
jan 1, 1995
54.363
-1.4
-2.51%
jan 1, 1996
54.012
-0.351
-0.65%
jan 1, 1997
53.285
-0.727
-1.35%
jan 1, 1998
55.619
+2.334
4.38%
jan 1, 1999
59.338
+3.719
6.69%
jan 1, 2000
59.964
+0.626
1.06%
jan 1, 2001
62.389
+2.425
4.04%
jan 1, 2002
64.913
+2.524
4.05%
jan 1, 2003
63.865
-1.048
-1.61%
jan 1, 2004
61.575
-2.29
-3.59%
jan 1, 2005
62.764
+1.189
1.93%
jan 1, 2006
62.21
-0.554
-0.88%
jan 1, 2007
58.734
-3.475
-5.59%
jan 1, 2008
56.902
-1.833
-3.12%
jan 1, 2009
59.419
+2.517
4.42%
jan 1, 2010
57.426
-1.992
-3.35%
jan 1, 2011
57.306
-0.12
-0.21%
jan 1, 2012
58.315
+1.009
1.76%
jan 1, 2013
56.153
-2.162
-3.71%
jan 1, 2014
56.191
+0.039
0.07%
Ranking of countries by current statistics by years


Comments: