29
/
en
AIzaSyAYiBZKx7MnpbEhh9jyipgxe19OcubqV5w
April 1, 2024
126949
El Salvador
SLV
true
2
1
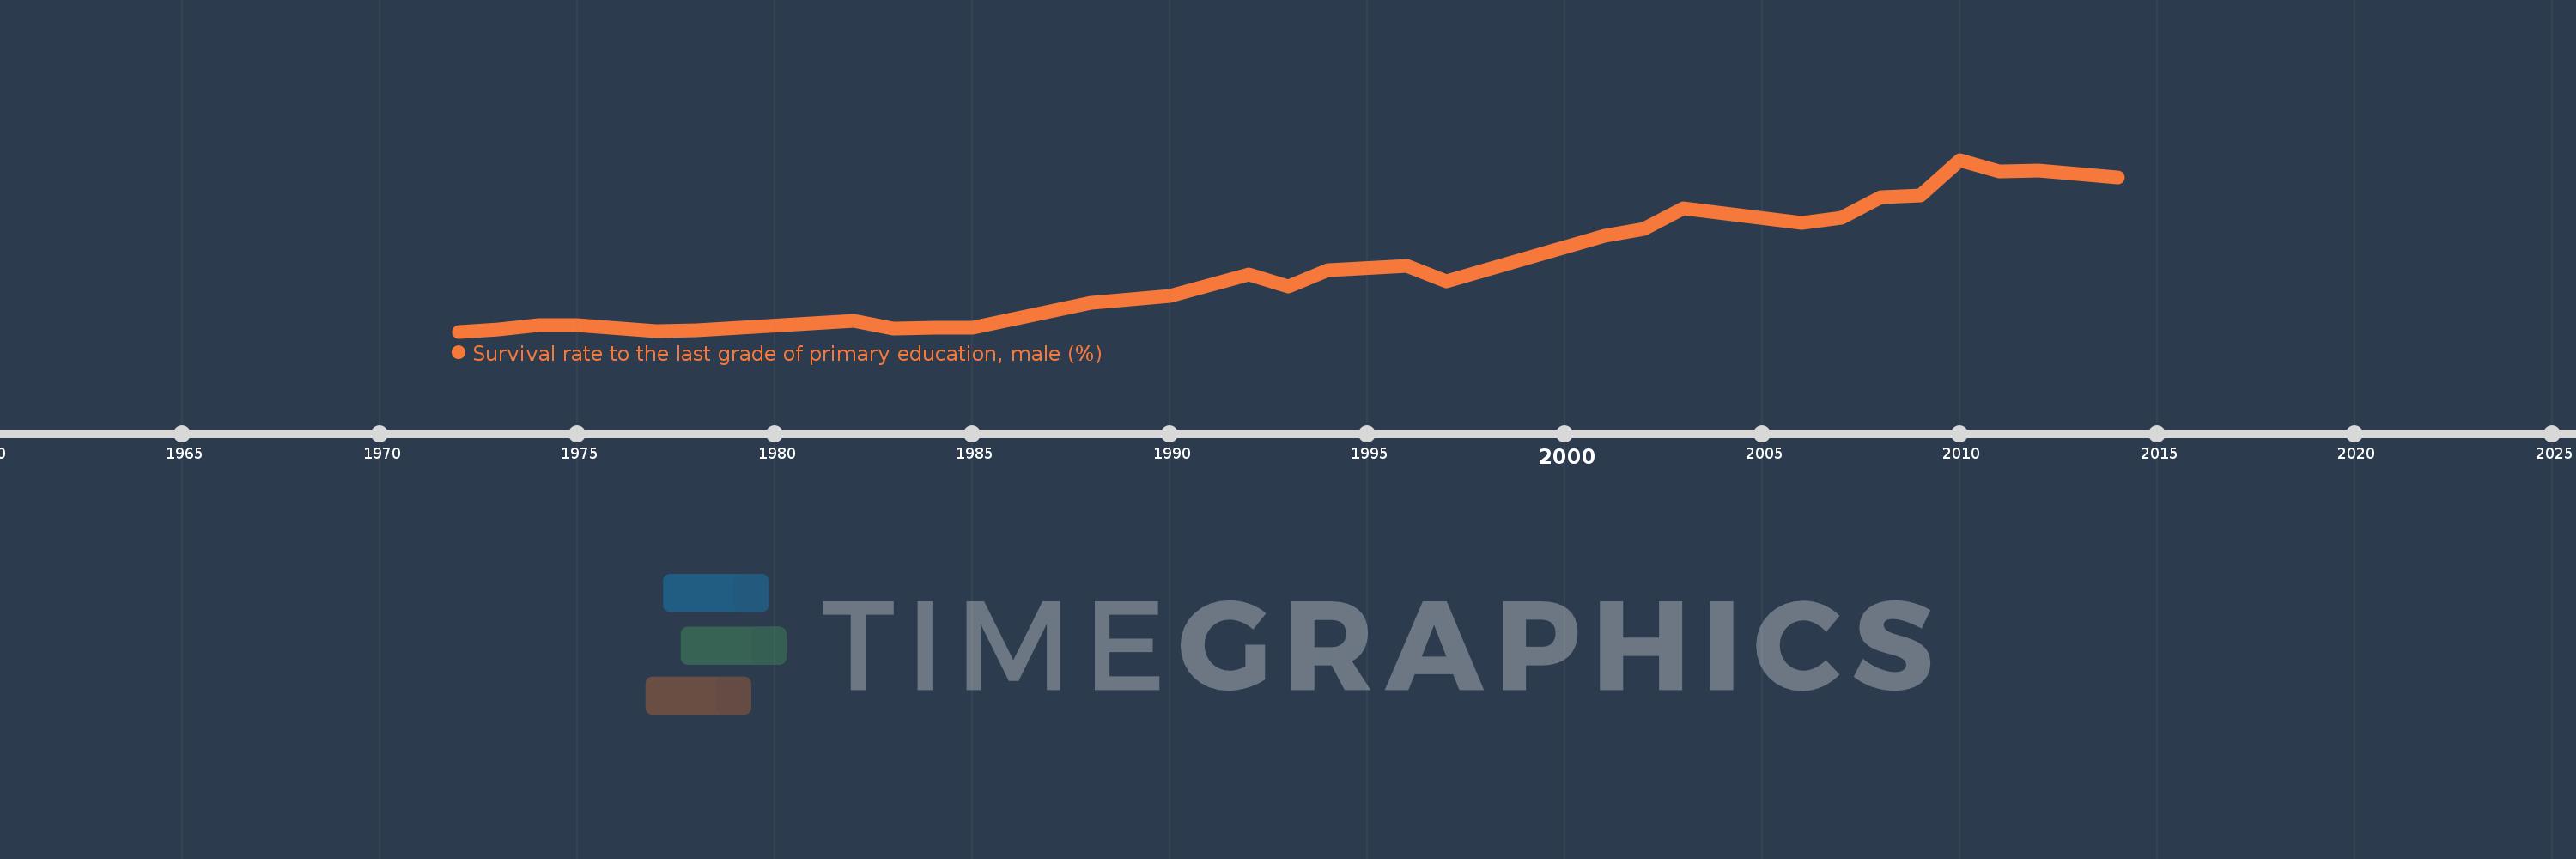
Survival rate to the last grade of primary education, male (%)
2014,2013,2012,2011,2010,2009,2008,2007,2006,2003,2002,2001,1997,1996,1994,1993,1992,1990,1989,1988,1985,1984,1983,1982,1978,1977,1975,1974,1973,1972
This statistics in other country:
AfghanistanAlbaniaAlgeriaAndorraAngolaArab WorldArgentinaArmeniaArubaAustriaAzerbaijanBahamas, TheBahrainBangladeshBarbadosBelarusBelgiumBelizeBeninBermudaBhutanBoliviaBosnia and HerzegovinaBotswanaBrazilBrunei DarussalamBulgariaBurkina FasoBurundiCabo VerdeCambodiaCameroonCanadaCaribbean small statesCentral African RepublicCentral Europe and the BalticsChadChileChinaColombiaComorosCongo, Dem. Rep.Congo, Rep.Costa RicaCote d'IvoireCroatiaCubaCyprusCzech RepublicDenmarkDjiboutiDominicaDominican RepublicEarly-demographic dividendEast Asia & PacificEast Asia & Pacific (excluding high income)East Asia & Pacific (IDA & IBRD countries)EcuadorEgypt, Arab Rep.El SalvadorEquatorial GuineaEritreaEstoniaEthiopiaEuro areaEurope & Central AsiaEurope & Central Asia (excluding high income)Europe & Central Asia (IDA & IBRD countries)European UnionFijiFinlandFragile and conflict affected situationsFranceGabonGambia, TheGeorgiaGermanyGhanaGreeceGuatemalaGuineaGuinea-BissauGuyanaHaitiHeavily indebted poor countries (HIPC)High incomeHondurasHong Kong SAR, ChinaHungaryIBRD onlyIcelandIDA & IBRD totalIDA blendIDA onlyIDA totalIndiaIndonesiaIran, Islamic Rep.IraqIsraelItalyJamaicaJapanJordanKazakhstanKenyaKiribatiKorea, Rep.KuwaitKyrgyz RepublicLao PDRLate-demographic dividendLatin America & Caribbean Latin America & Caribbean (excluding high income)Latin America & the Caribbean (IDA & IBRD countries)LatviaLeast developed countries: UN classificationLebanonLesothoLiberiaLibyaLiechtensteinLithuaniaLow & middle incomeLow incomeLower middle incomeLuxembourgMacao SAR, ChinaMacedonia, FYRMadagascarMalawiMalaysiaMaldivesMaliMaltaMarshall IslandsMauritaniaMauritiusMexicoMiddle East & North AfricaMiddle East & North Africa (excluding high income)Middle East & North Africa (IDA & IBRD countries)Middle incomeMoldovaMongoliaMontenegroMoroccoMozambiqueMyanmarNamibiaNepalNetherlandsNicaraguaNigerNigeriaNorth AmericaNorwayOECD membersOmanOther small statesPacific island small statesPakistanPanamaPapua New GuineaParaguayPeruPhilippinesPolandPortugalPost-demographic dividendPre-demographic dividendQatarRomaniaRussian FederationRwandaSamoaSan MarinoSao Tome and PrincipeSaudi ArabiaSenegalSerbiaSeychellesSierra LeoneSingaporeSlovak RepublicSloveniaSmall statesSolomon IslandsSouth AfricaSouth AsiaSouth Asia (IDA & IBRD)SpainSri LankaSt. Kitts and NevisSt. LuciaSt. Vincent and the GrenadinesSub-Saharan Africa Sub-Saharan Africa (excluding high income)Sub-Saharan Africa (IDA & IBRD countries)SudanSurinameSwazilandSwedenSwitzerlandSyrian Arab RepublicTajikistanTanzaniaThailandTimor-LesteTogoTongaTrinidad and TobagoTunisiaTurkeyUgandaUkraineUnited Arab EmiratesUpper middle incomeUruguayUzbekistanVanuatuVenezuela, RBVietnamWest Bank and GazaWorldYemen, Rep.ZambiaZimbabwe Timeline:
This timeline shows a graph from 1972 to 2014 of El Salvador. No data until 1971. Number of actual observations by date: 30.
Source name:
World Development Indicators
Source organization:
UNESCO Institute for Statistics
Categories, topics:
Education, Gender
Last updated:
apr 23, 2017
Indicators value changes by year
Minimum:
29.538
jan 1, 1972
Maximum:
86.017
jan 1, 2010
At the date of observation
Value
Absolute change
Change from previous value
jan 1, 1972
29.538
+29.538
0.0%
jan 1, 1973
30.334
+0.796
2.69%
jan 1, 1974
31.693
+1.359
4.48%
jan 1, 1975
31.521
-0.172
-0.54%
jan 1, 1977
29.686
-1.835
-5.82%
jan 1, 1978
29.896
+0.21
0.71%
jan 1, 1982
33.11
+3.215
10.75%
jan 1, 1983
30.462
-2.649
-8.0%
jan 1, 1984
30.876
+0.414
1.36%
jan 1, 1985
30.827
-0.049
-0.16%
jan 1, 1988
38.912
+8.085
26.23%
jan 1, 1989
40.246
+1.334
3.43%
jan 1, 1990
41.123
+0.877
2.18%
jan 1, 1992
48.32
+7.196
17.5%
jan 1, 1993
44.486
-3.834
-7.93%
jan 1, 1994
49.783
+5.297
11.91%
jan 1, 1996
51.146
+1.363
2.74%
jan 1, 1997
45.944
-5.202
-10.17%
jan 1, 2001
61.147
+15.204
33.09%
jan 1, 2002
63.296
+2.149
3.51%
jan 1, 2003
69.954
+6.658
10.52%
jan 1, 2006
65.177
-4.777
-6.83%
jan 1, 2007
66.955
+1.778
2.73%
jan 1, 2008
73.853
+6.898
10.3%
jan 1, 2009
74.237
+0.384
0.52%
jan 1, 2010
86.017
+11.781
15.87%
jan 1, 2011
82.111
-3.906
-4.54%
jan 1, 2012
82.347
+0.236
0.29%
jan 1, 2013
81.475
-0.872
-1.06%
jan 1, 2014
80.274
-1.202
-1.47%
Ranking of countries by current statistics by years


Comments: