29
/
en
AIzaSyAYiBZKx7MnpbEhh9jyipgxe19OcubqV5w
April 1, 2024
51521
Middle income
MIC
false
2
1
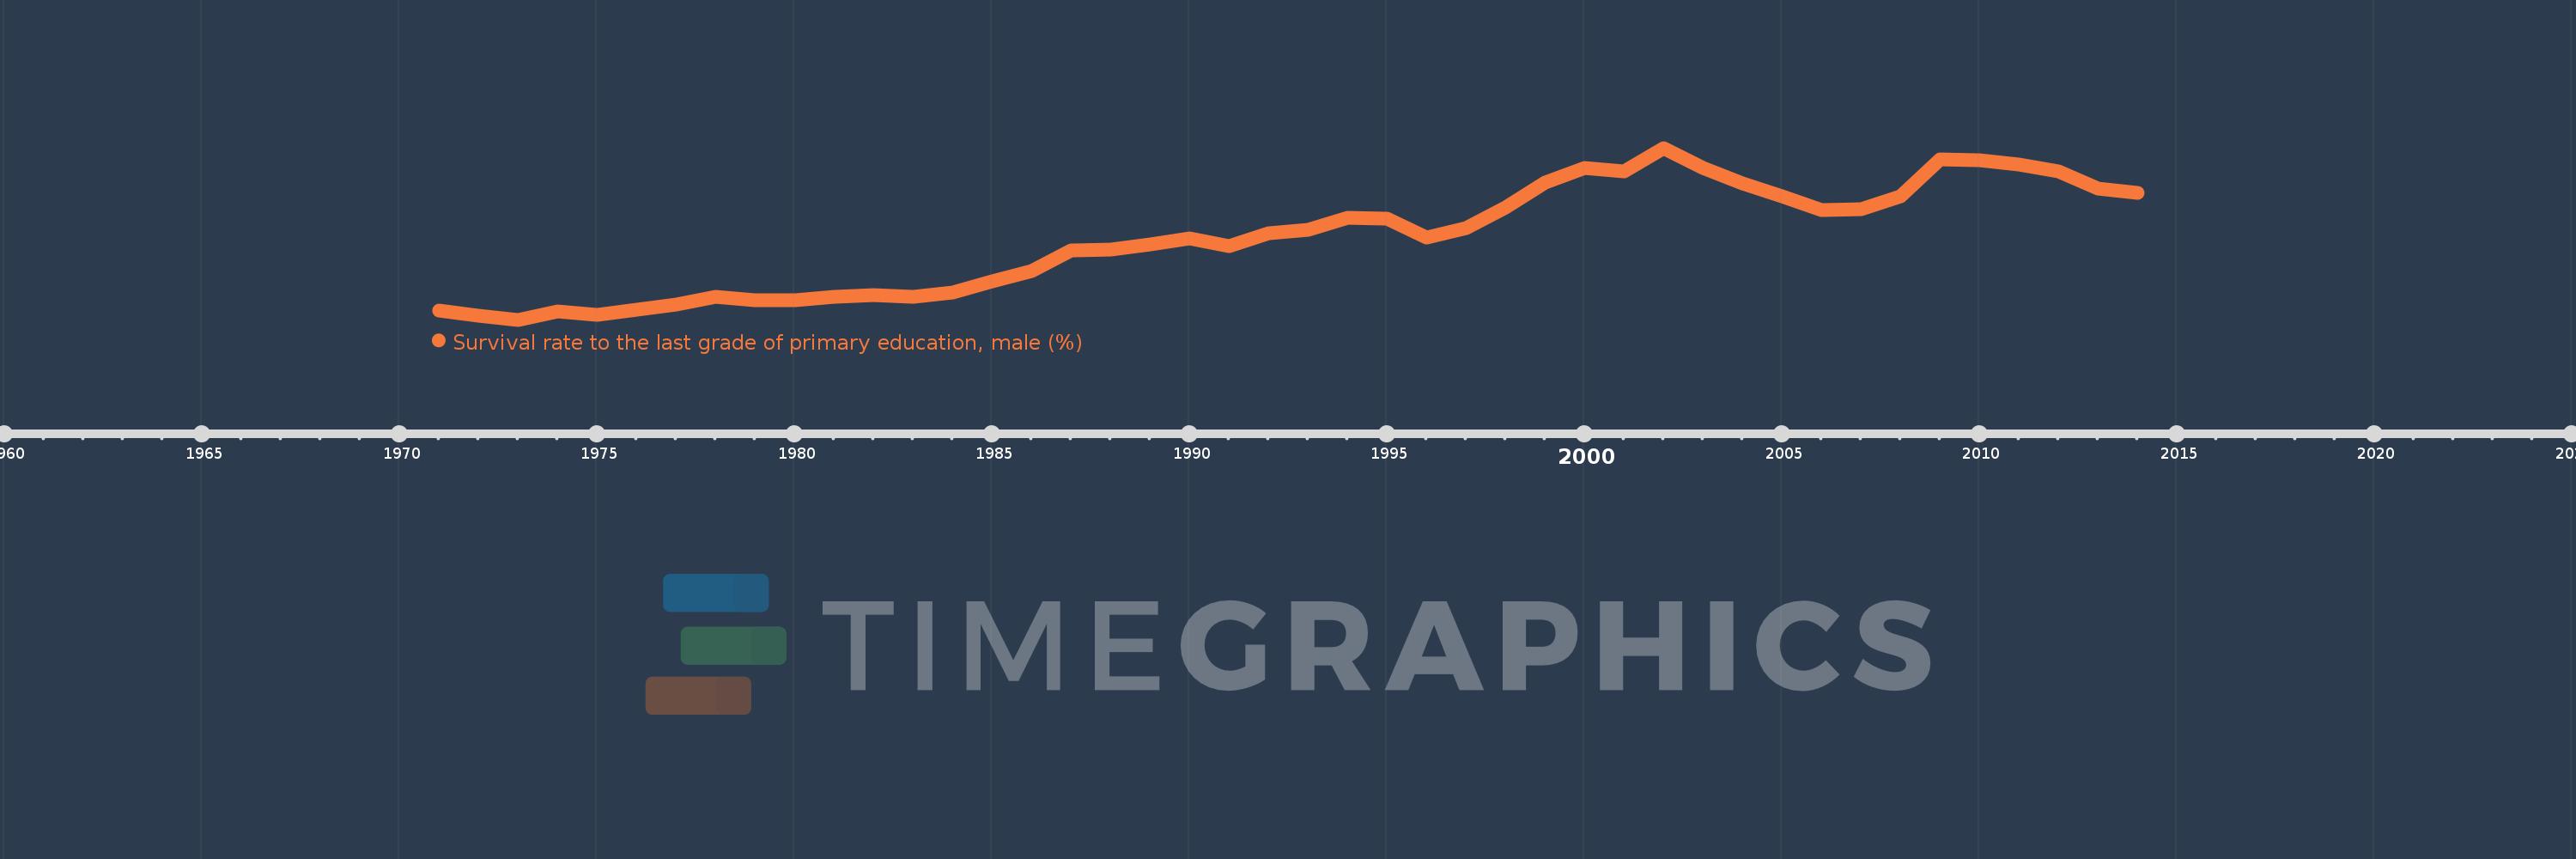
Survival rate to the last grade of primary education, male (%)
2014,2013,2012,2011,2010,2009,2008,2007,2006,2005,2004,2003,2002,2001,2000,1999,1998,1997,1996,1995,1994,1993,1992,1991,1990,1989,1988,1987,1986,1985,1984,1983,1982,1981,1980,1979,1978,1977,1976,1975,1974,1973,1972,1971
This statistics in other country:
AfghanistanAlbaniaAlgeriaAndorraAngolaArab WorldArgentinaArmeniaArubaAustriaAzerbaijanBahamas, TheBahrainBangladeshBarbadosBelarusBelgiumBelizeBeninBermudaBhutanBoliviaBosnia and HerzegovinaBotswanaBrazilBrunei DarussalamBulgariaBurkina FasoBurundiCabo VerdeCambodiaCameroonCanadaCaribbean small statesCentral African RepublicCentral Europe and the BalticsChadChileChinaColombiaComorosCongo, Dem. Rep.Congo, Rep.Costa RicaCote d'IvoireCroatiaCubaCyprusCzech RepublicDenmarkDjiboutiDominicaDominican RepublicEarly-demographic dividendEast Asia & PacificEast Asia & Pacific (excluding high income)East Asia & Pacific (IDA & IBRD countries)EcuadorEgypt, Arab Rep.El SalvadorEquatorial GuineaEritreaEstoniaEthiopiaEuro areaEurope & Central AsiaEurope & Central Asia (excluding high income)Europe & Central Asia (IDA & IBRD countries)European UnionFijiFinlandFragile and conflict affected situationsFranceGabonGambia, TheGeorgiaGermanyGhanaGreeceGuatemalaGuineaGuinea-BissauGuyanaHaitiHeavily indebted poor countries (HIPC)High incomeHondurasHong Kong SAR, ChinaHungaryIBRD onlyIcelandIDA & IBRD totalIDA blendIDA onlyIDA totalIndiaIndonesiaIran, Islamic Rep.IraqIsraelItalyJamaicaJapanJordanKazakhstanKenyaKiribatiKorea, Rep.KuwaitKyrgyz RepublicLao PDRLate-demographic dividendLatin America & Caribbean Latin America & Caribbean (excluding high income)Latin America & the Caribbean (IDA & IBRD countries)LatviaLeast developed countries: UN classificationLebanonLesothoLiberiaLibyaLiechtensteinLithuaniaLow & middle incomeLow incomeLower middle incomeLuxembourgMacao SAR, ChinaMacedonia, FYRMadagascarMalawiMalaysiaMaldivesMaliMaltaMarshall IslandsMauritaniaMauritiusMexicoMiddle East & North AfricaMiddle East & North Africa (excluding high income)Middle East & North Africa (IDA & IBRD countries)Middle incomeMoldovaMongoliaMontenegroMoroccoMozambiqueMyanmarNamibiaNepalNetherlandsNicaraguaNigerNigeriaNorth AmericaNorwayOECD membersOmanOther small statesPacific island small statesPakistanPanamaPapua New GuineaParaguayPeruPhilippinesPolandPortugalPost-demographic dividendPre-demographic dividendQatarRomaniaRussian FederationRwandaSamoaSan MarinoSao Tome and PrincipeSaudi ArabiaSenegalSerbiaSeychellesSierra LeoneSingaporeSlovak RepublicSloveniaSmall statesSolomon IslandsSouth AfricaSouth AsiaSouth Asia (IDA & IBRD)SpainSri LankaSt. Kitts and NevisSt. LuciaSt. Vincent and the GrenadinesSub-Saharan Africa Sub-Saharan Africa (excluding high income)Sub-Saharan Africa (IDA & IBRD countries)SudanSurinameSwazilandSwedenSwitzerlandSyrian Arab RepublicTajikistanTanzaniaThailandTimor-LesteTogoTongaTrinidad and TobagoTunisiaTurkeyUgandaUkraineUnited Arab EmiratesUpper middle incomeUruguayUzbekistanVanuatuVenezuela, RBVietnamWest Bank and GazaWorldYemen, Rep.ZambiaZimbabwe Timeline:
This timeline shows a graph from 1971 to 2014 of Middle income. No data until 1970. Number of actual observations by date: 44.
Source name:
World Development Indicators
Source organization:
UNESCO Institute for Statistics
Categories, topics:
Education, Gender
Last updated:
apr 23, 2017
Indicators value changes by year
Minimum:
64.405
jan 1, 1973
Maximum:
76.545
jan 1, 2002
At the date of observation
Value
Absolute change
Change from previous value
jan 1, 1971
65.063
+65.063
0.0%
jan 1, 1972
64.703
-0.36
-0.55%
jan 1, 1973
64.405
-0.298
-0.46%
jan 1, 1974
64.969
+0.564
0.88%
jan 1, 1975
64.777
-0.192
-0.3%
jan 1, 1976
65.137
+0.36
0.56%
jan 1, 1977
65.486
+0.349
0.54%
jan 1, 1978
66.054
+0.568
0.87%
jan 1, 1979
65.802
-0.252
-0.38%
jan 1, 1980
65.804
+0.002
0.0%
jan 1, 1981
65.997
+0.193
0.29%
jan 1, 1982
66.166
+0.169
0.26%
jan 1, 1983
66.032
-0.134
-0.2%
jan 1, 1984
66.309
+0.276
0.42%
jan 1, 1985
67.129
+0.82
1.24%
jan 1, 1986
67.837
+0.708
1.05%
jan 1, 1987
69.33
+1.494
2.2%
jan 1, 1988
69.367
+0.037
0.05%
jan 1, 1989
69.707
+0.339
0.49%
jan 1, 1990
70.176
+0.469
0.67%
jan 1, 1991
69.58
-0.595
-0.85%
jan 1, 1992
70.523
+0.943
1.36%
jan 1, 1993
70.768
+0.244
0.35%
jan 1, 1994
71.586
+0.819
1.16%
jan 1, 1995
71.533
-0.053
-0.07%
jan 1, 1996
70.238
-1.296
-1.81%
jan 1, 1997
70.867
+0.63
0.9%
jan 1, 1998
72.362
+1.494
2.11%
jan 1, 1999
74.077
+1.716
2.37%
jan 1, 2000
75.138
+1.061
1.43%
jan 1, 2001
74.878
-0.26
-0.35%
jan 1, 2002
76.545
+1.668
2.23%
jan 1, 2003
75.154
-1.391
-1.82%
jan 1, 2004
74.056
-1.098
-1.46%
jan 1, 2005
73.122
-0.935
-1.26%
jan 1, 2006
72.176
-0.946
-1.29%
jan 1, 2007
72.244
+0.067
0.09%
jan 1, 2008
73.147
+0.904
1.25%
jan 1, 2009
75.722
+2.575
3.52%
jan 1, 2010
75.651
-0.071
-0.09%
jan 1, 2011
75.398
-0.254
-0.34%
jan 1, 2012
74.874
-0.524
-0.69%
jan 1, 2013
73.667
-1.207
-1.61%
jan 1, 2014
73.352
-0.315
-0.43%
Ranking of countries by current statistics by years


Comments: