29
/
en
AIzaSyAYiBZKx7MnpbEhh9jyipgxe19OcubqV5w
April 1, 2024
33894
European Union
EUU
false
2
1
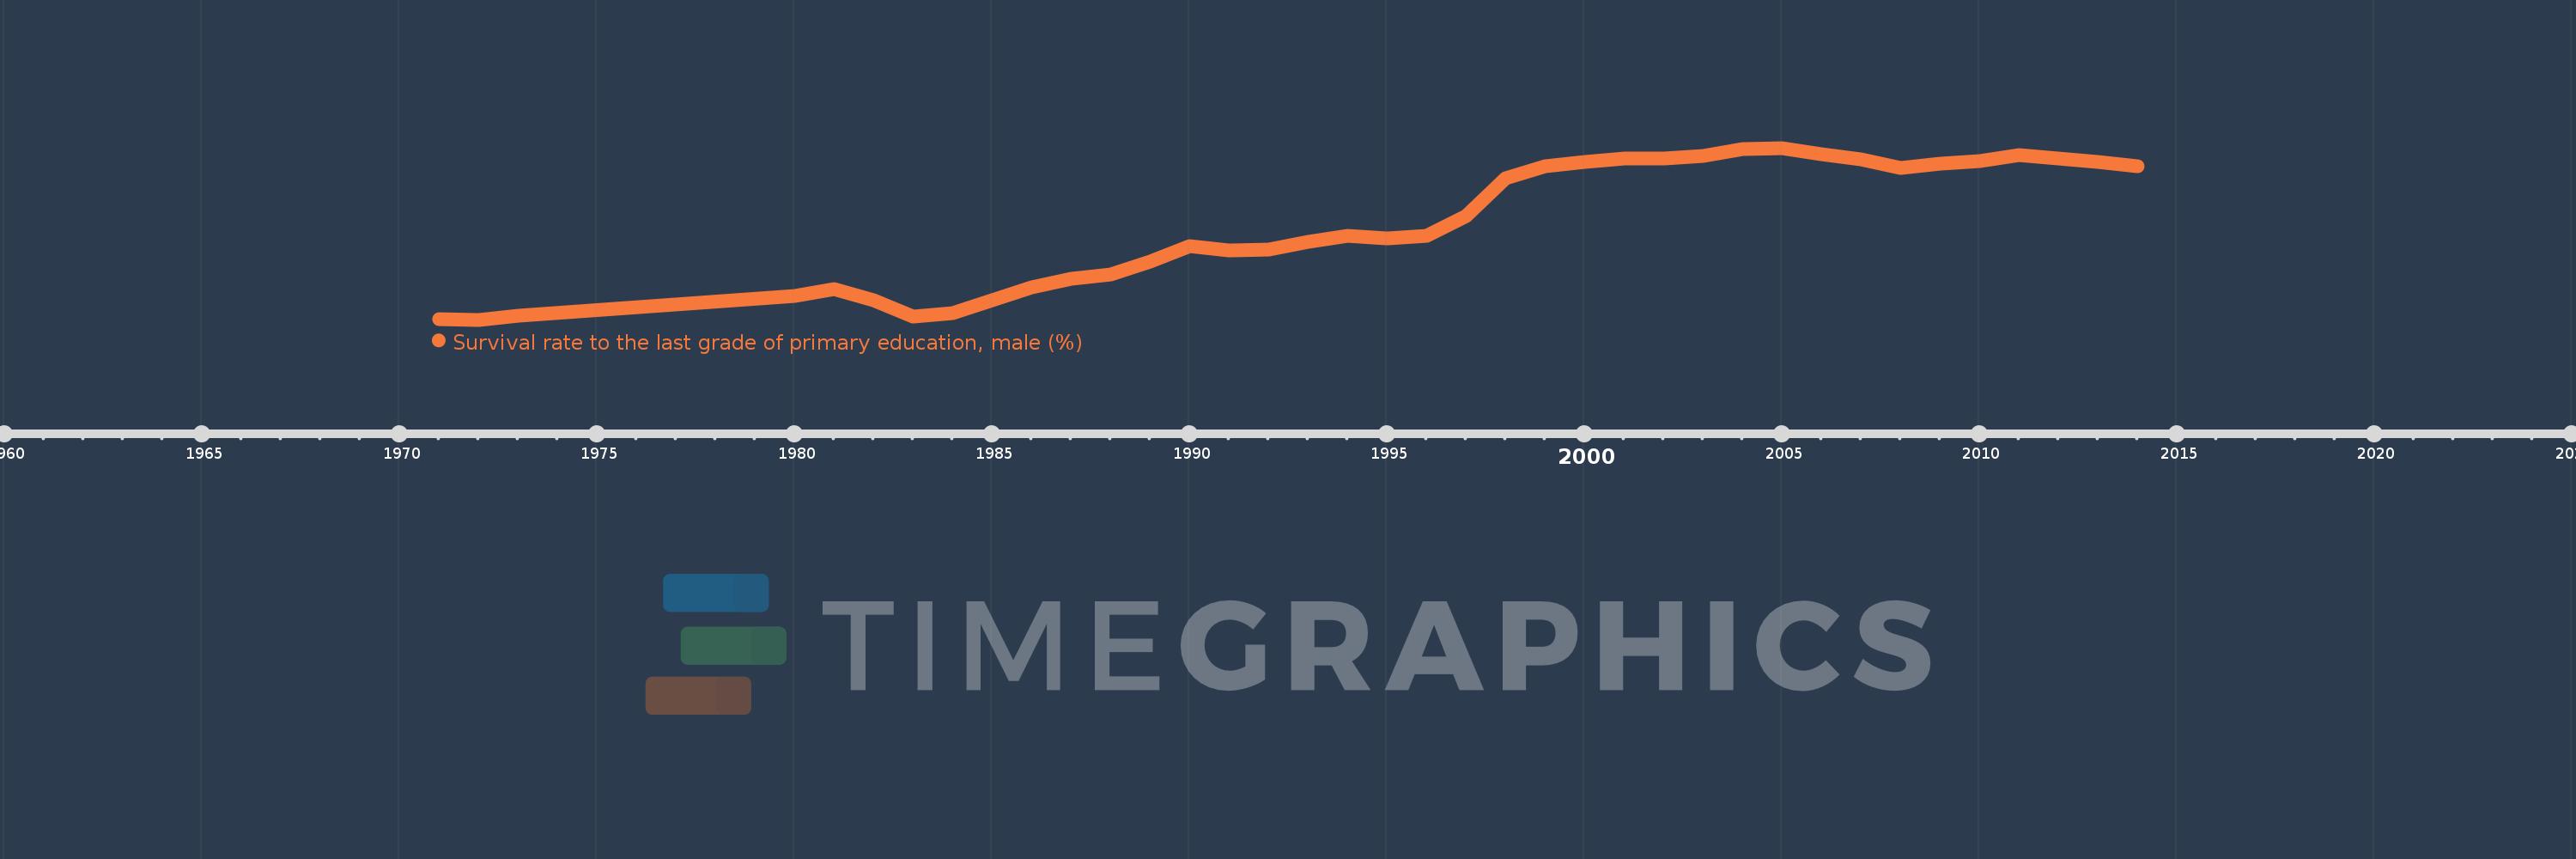
Survival rate to the last grade of primary education, male (%)
2014,2013,2012,2011,2010,2009,2008,2007,2006,2005,2004,2003,2002,2001,2000,1999,1998,1997,1996,1995,1994,1993,1992,1991,1990,1989,1988,1987,1986,1985,1984,1983,1982,1981,1980,1973,1972,1971
This statistics in other country:
AfghanistanAlbaniaAlgeriaAndorraAngolaArab WorldArgentinaArmeniaArubaAustriaAzerbaijanBahamas, TheBahrainBangladeshBarbadosBelarusBelgiumBelizeBeninBermudaBhutanBoliviaBosnia and HerzegovinaBotswanaBrazilBrunei DarussalamBulgariaBurkina FasoBurundiCabo VerdeCambodiaCameroonCanadaCaribbean small statesCentral African RepublicCentral Europe and the BalticsChadChileChinaColombiaComorosCongo, Dem. Rep.Congo, Rep.Costa RicaCote d'IvoireCroatiaCubaCyprusCzech RepublicDenmarkDjiboutiDominicaDominican RepublicEarly-demographic dividendEast Asia & PacificEast Asia & Pacific (excluding high income)East Asia & Pacific (IDA & IBRD countries)EcuadorEgypt, Arab Rep.El SalvadorEquatorial GuineaEritreaEstoniaEthiopiaEuro areaEurope & Central AsiaEurope & Central Asia (excluding high income)Europe & Central Asia (IDA & IBRD countries)European UnionFijiFinlandFragile and conflict affected situationsFranceGabonGambia, TheGeorgiaGermanyGhanaGreeceGuatemalaGuineaGuinea-BissauGuyanaHaitiHeavily indebted poor countries (HIPC)High incomeHondurasHong Kong SAR, ChinaHungaryIBRD onlyIcelandIDA & IBRD totalIDA blendIDA onlyIDA totalIndiaIndonesiaIran, Islamic Rep.IraqIsraelItalyJamaicaJapanJordanKazakhstanKenyaKiribatiKorea, Rep.KuwaitKyrgyz RepublicLao PDRLate-demographic dividendLatin America & Caribbean Latin America & Caribbean (excluding high income)Latin America & the Caribbean (IDA & IBRD countries)LatviaLeast developed countries: UN classificationLebanonLesothoLiberiaLibyaLiechtensteinLithuaniaLow & middle incomeLow incomeLower middle incomeLuxembourgMacao SAR, ChinaMacedonia, FYRMadagascarMalawiMalaysiaMaldivesMaliMaltaMarshall IslandsMauritaniaMauritiusMexicoMiddle East & North AfricaMiddle East & North Africa (excluding high income)Middle East & North Africa (IDA & IBRD countries)Middle incomeMoldovaMongoliaMontenegroMoroccoMozambiqueMyanmarNamibiaNepalNetherlandsNicaraguaNigerNigeriaNorth AmericaNorwayOECD membersOmanOther small statesPacific island small statesPakistanPanamaPapua New GuineaParaguayPeruPhilippinesPolandPortugalPost-demographic dividendPre-demographic dividendQatarRomaniaRussian FederationRwandaSamoaSan MarinoSao Tome and PrincipeSaudi ArabiaSenegalSerbiaSeychellesSierra LeoneSingaporeSlovak RepublicSloveniaSmall statesSolomon IslandsSouth AfricaSouth AsiaSouth Asia (IDA & IBRD)SpainSri LankaSt. Kitts and NevisSt. LuciaSt. Vincent and the GrenadinesSub-Saharan Africa Sub-Saharan Africa (excluding high income)Sub-Saharan Africa (IDA & IBRD countries)SudanSurinameSwazilandSwedenSwitzerlandSyrian Arab RepublicTajikistanTanzaniaThailandTimor-LesteTogoTongaTrinidad and TobagoTunisiaTurkeyUgandaUkraineUnited Arab EmiratesUpper middle incomeUruguayUzbekistanVanuatuVenezuela, RBVietnamWest Bank and GazaWorldYemen, Rep.ZambiaZimbabwe Timeline:
This timeline shows a graph from 1971 to 2014 of European Union. No data until 1970. Number of actual observations by date: 38.
Source name:
World Development Indicators
Source organization:
UNESCO Institute for Statistics
Categories, topics:
Education, Gender
Last updated:
apr 23, 2017
Indicators value changes by year
Minimum:
87.837
jan 1, 1972
Maximum:
95.896
jan 1, 2005
At the date of observation
Value
Absolute change
Change from previous value
jan 1, 1971
87.871
+87.871
0.0%
jan 1, 1972
87.837
-0.034
-0.04%
jan 1, 1973
88.027
+0.189
0.22%
jan 1, 1980
88.965
+0.938
1.07%
jan 1, 1981
89.295
+0.33
0.37%
jan 1, 1982
88.742
-0.553
-0.62%
jan 1, 1983
87.998
-0.744
-0.84%
jan 1, 1984
88.129
+0.131
0.15%
jan 1, 1985
88.737
+0.608
0.69%
jan 1, 1986
89.355
+0.618
0.7%
jan 1, 1987
89.739
+0.384
0.43%
jan 1, 1988
89.953
+0.213
0.24%
jan 1, 1989
90.565
+0.612
0.68%
jan 1, 1990
91.298
+0.733
0.81%
jan 1, 1991
91.087
-0.212
-0.23%
jan 1, 1992
91.131
+0.044
0.05%
jan 1, 1993
91.492
+0.361
0.4%
jan 1, 1994
91.781
+0.289
0.32%
jan 1, 1995
91.649
-0.132
-0.14%
jan 1, 1996
91.767
+0.119
0.13%
jan 1, 1997
92.707
+0.939
1.02%
jan 1, 1998
94.455
+1.749
1.89%
jan 1, 1999
95.023
+0.568
0.6%
jan 1, 2000
95.228
+0.204
0.22%
jan 1, 2001
95.382
+0.155
0.16%
jan 1, 2002
95.405
+0.022
0.02%
jan 1, 2003
95.53
+0.125
0.13%
jan 1, 2004
95.842
+0.312
0.33%
jan 1, 2005
95.896
+0.053
0.06%
jan 1, 2006
95.599
-0.297
-0.31%
jan 1, 2007
95.369
-0.229
-0.24%
jan 1, 2008
94.953
-0.416
-0.44%
jan 1, 2009
95.162
+0.208
0.22%
jan 1, 2010
95.276
+0.114
0.12%
jan 1, 2011
95.562
+0.286
0.3%
jan 1, 2012
95.39
-0.171
-0.18%
jan 1, 2013
95.255
-0.136
-0.14%
jan 1, 2014
95.047
-0.208
-0.22%
Ranking of countries by current statistics by years


Comments: