29
/
en
AIzaSyAYiBZKx7MnpbEhh9jyipgxe19OcubqV5w
April 1, 2024
221598
Paraguay
PRY
true
2
1
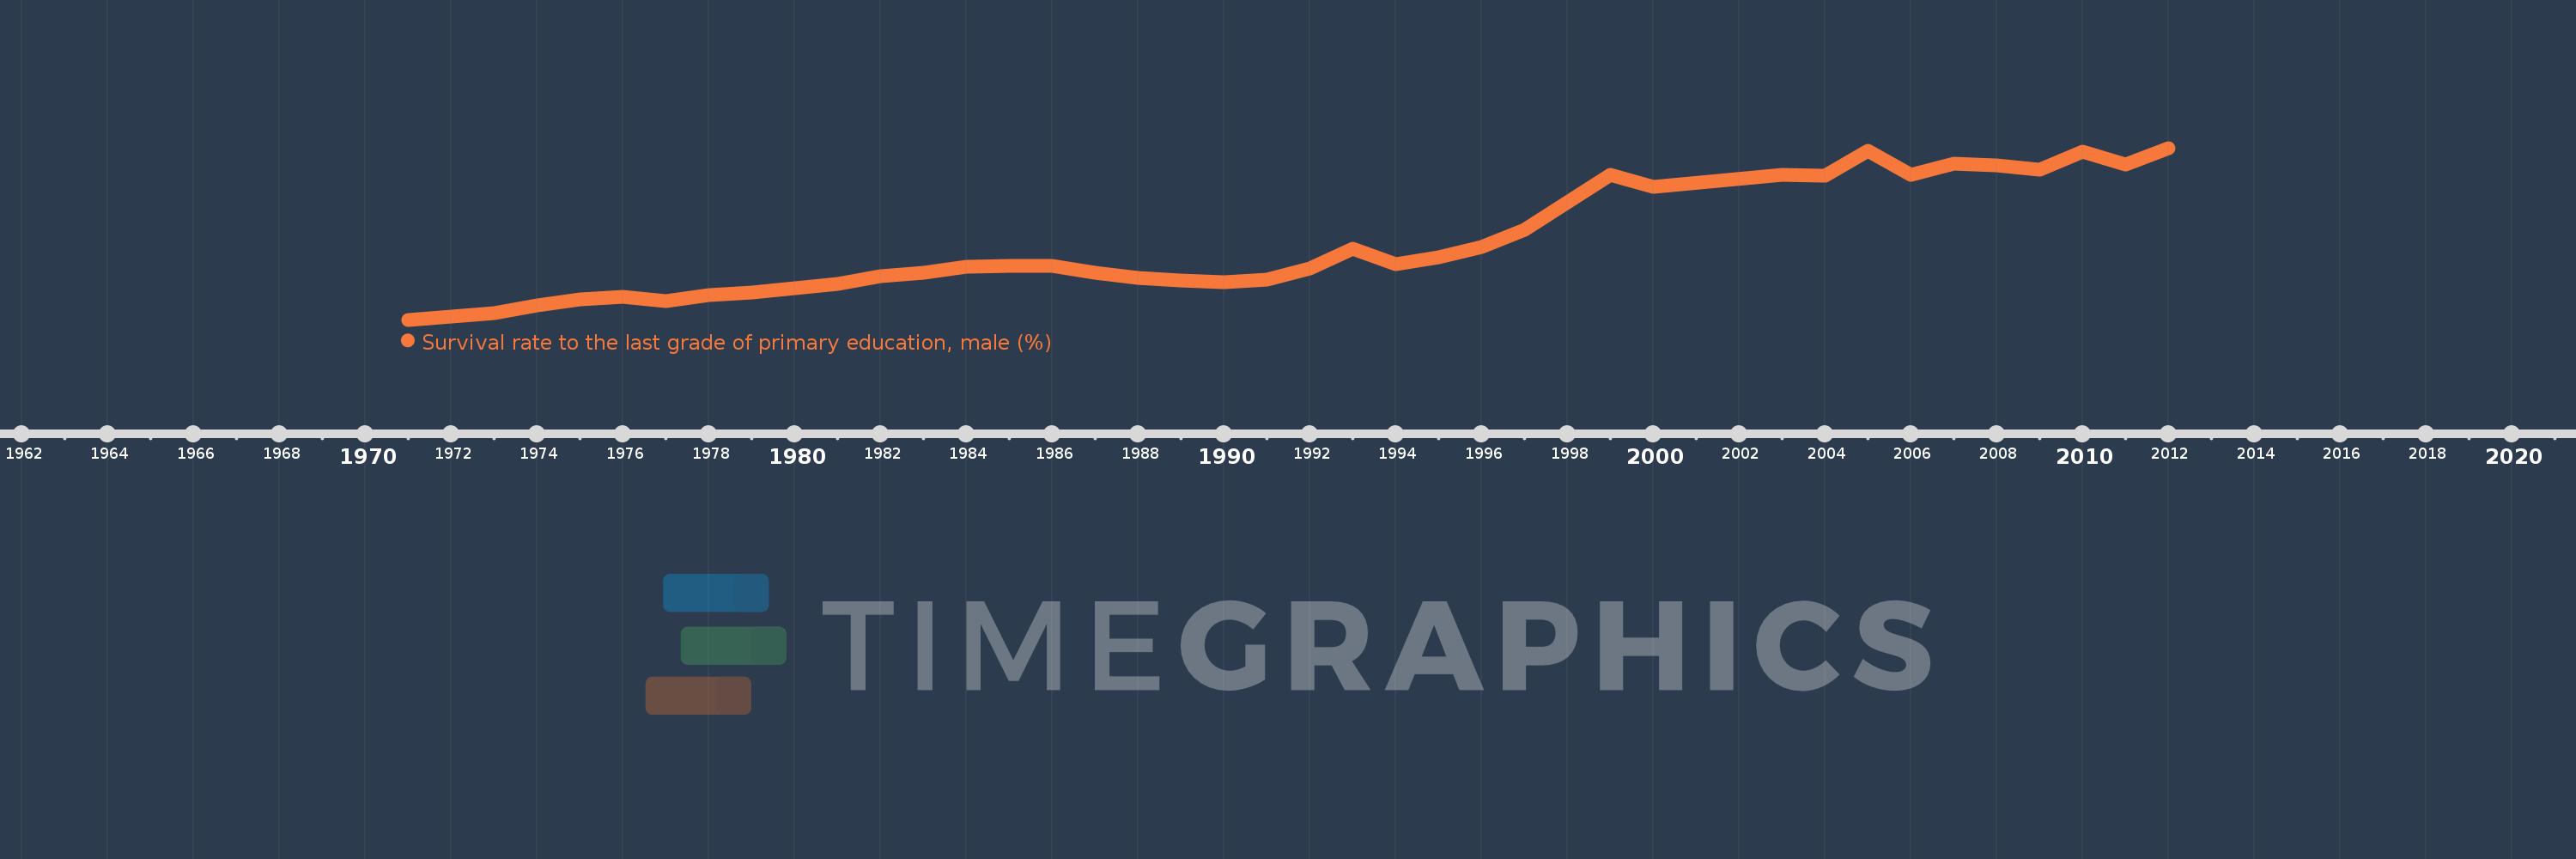
Survival rate to the last grade of primary education, male (%)
2012,2011,2010,2009,2008,2007,2006,2005,2004,2003,2000,1999,1997,1996,1995,1994,1993,1992,1991,1990,1989,1988,1987,1986,1985,1984,1983,1982,1981,1979,1978,1977,1976,1975,1974,1973,1971
This statistics in other country:
AfghanistanAlbaniaAlgeriaAndorraAngolaArab WorldArgentinaArmeniaArubaAustriaAzerbaijanBahamas, TheBahrainBangladeshBarbadosBelarusBelgiumBelizeBeninBermudaBhutanBoliviaBosnia and HerzegovinaBotswanaBrazilBrunei DarussalamBulgariaBurkina FasoBurundiCabo VerdeCambodiaCameroonCanadaCaribbean small statesCentral African RepublicCentral Europe and the BalticsChadChileChinaColombiaComorosCongo, Dem. Rep.Congo, Rep.Costa RicaCote d'IvoireCroatiaCubaCyprusCzech RepublicDenmarkDjiboutiDominicaDominican RepublicEarly-demographic dividendEast Asia & PacificEast Asia & Pacific (excluding high income)East Asia & Pacific (IDA & IBRD countries)EcuadorEgypt, Arab Rep.El SalvadorEquatorial GuineaEritreaEstoniaEthiopiaEuro areaEurope & Central AsiaEurope & Central Asia (excluding high income)Europe & Central Asia (IDA & IBRD countries)European UnionFijiFinlandFragile and conflict affected situationsFranceGabonGambia, TheGeorgiaGermanyGhanaGreeceGuatemalaGuineaGuinea-BissauGuyanaHaitiHeavily indebted poor countries (HIPC)High incomeHondurasHong Kong SAR, ChinaHungaryIBRD onlyIcelandIDA & IBRD totalIDA blendIDA onlyIDA totalIndiaIndonesiaIran, Islamic Rep.IraqIsraelItalyJamaicaJapanJordanKazakhstanKenyaKiribatiKorea, Rep.KuwaitKyrgyz RepublicLao PDRLate-demographic dividendLatin America & Caribbean Latin America & Caribbean (excluding high income)Latin America & the Caribbean (IDA & IBRD countries)LatviaLeast developed countries: UN classificationLebanonLesothoLiberiaLibyaLiechtensteinLithuaniaLow & middle incomeLow incomeLower middle incomeLuxembourgMacao SAR, ChinaMacedonia, FYRMadagascarMalawiMalaysiaMaldivesMaliMaltaMarshall IslandsMauritaniaMauritiusMexicoMiddle East & North AfricaMiddle East & North Africa (excluding high income)Middle East & North Africa (IDA & IBRD countries)Middle incomeMoldovaMongoliaMontenegroMoroccoMozambiqueMyanmarNamibiaNepalNetherlandsNicaraguaNigerNigeriaNorth AmericaNorwayOECD membersOmanOther small statesPacific island small statesPakistanPanamaPapua New GuineaParaguayPeruPhilippinesPolandPortugalPost-demographic dividendPre-demographic dividendQatarRomaniaRussian FederationRwandaSamoaSan MarinoSao Tome and PrincipeSaudi ArabiaSenegalSerbiaSeychellesSierra LeoneSingaporeSlovak RepublicSloveniaSmall statesSolomon IslandsSouth AfricaSouth AsiaSouth Asia (IDA & IBRD)SpainSri LankaSt. Kitts and NevisSt. LuciaSt. Vincent and the GrenadinesSub-Saharan Africa Sub-Saharan Africa (excluding high income)Sub-Saharan Africa (IDA & IBRD countries)SudanSurinameSwazilandSwedenSwitzerlandSyrian Arab RepublicTajikistanTanzaniaThailandTimor-LesteTogoTongaTrinidad and TobagoTunisiaTurkeyUgandaUkraineUnited Arab EmiratesUpper middle incomeUruguayUzbekistanVanuatuVenezuela, RBVietnamWest Bank and GazaWorldYemen, Rep.ZambiaZimbabwe Timeline:
This timeline shows a graph from 1971 to 2012 of Paraguay. No data until 1970. Number of actual observations by date: 37.
Source name:
World Development Indicators
Source organization:
UNESCO Institute for Statistics
Categories, topics:
Education, Gender
Last updated:
apr 23, 2017
Indicators value changes by year
Minimum:
32.061
jan 1, 1971
Maximum:
82.506
jan 1, 2012
At the date of observation
Value
Absolute change
Change from previous value
jan 1, 1971
32.061
+32.061
0.0%
jan 1, 1973
34.015
+1.954
6.09%
jan 1, 1974
36.231
+2.216
6.52%
jan 1, 1975
38.075
+1.844
5.09%
jan 1, 1976
38.753
+0.678
1.78%
jan 1, 1977
37.496
-1.258
-3.25%
jan 1, 1978
39.205
+1.709
4.56%
jan 1, 1979
39.971
+0.766
1.95%
jan 1, 1981
42.684
+2.713
6.79%
jan 1, 1982
44.726
+2.043
4.79%
jan 1, 1983
45.953
+1.227
2.74%
jan 1, 1984
47.525
+1.572
3.42%
jan 1, 1985
47.823
+0.298
0.63%
jan 1, 1986
47.877
+0.053
0.11%
jan 1, 1987
45.754
-2.122
-4.43%
jan 1, 1988
44.349
-1.406
-3.07%
jan 1, 1989
43.52
-0.828
-1.87%
jan 1, 1990
42.989
-0.532
-1.22%
jan 1, 1991
43.85
+0.862
2.0%
jan 1, 1992
47.141
+3.291
7.5%
jan 1, 1993
52.927
+5.786
12.27%
jan 1, 1994
48.472
-4.454
-8.42%
jan 1, 1995
50.34
+1.867
3.85%
jan 1, 1996
53.528
+3.188
6.33%
jan 1, 1997
58.462
+4.934
9.22%
jan 1, 1999
74.63
+16.168
27.66%
jan 1, 2000
71.142
-3.489
-4.67%
jan 1, 2003
74.717
+3.575
5.02%
jan 1, 2004
74.39
-0.327
-0.44%
jan 1, 2005
81.711
+7.322
9.84%
jan 1, 2006
74.543
-7.169
-8.77%
jan 1, 2007
77.916
+3.374
4.53%
jan 1, 2008
77.452
-0.464
-0.6%
jan 1, 2009
76.064
-1.388
-1.79%
jan 1, 2010
81.407
+5.342
7.02%
jan 1, 2011
77.532
-3.875
-4.76%
jan 1, 2012
82.506
+4.974
6.42%
Ranking of countries by current statistics by years


Comments: