29
/
en
AIzaSyAYiBZKx7MnpbEhh9jyipgxe19OcubqV5w
April 1, 2024
58571
South Asia (IDA & IBRD)
TSA
false
2
1
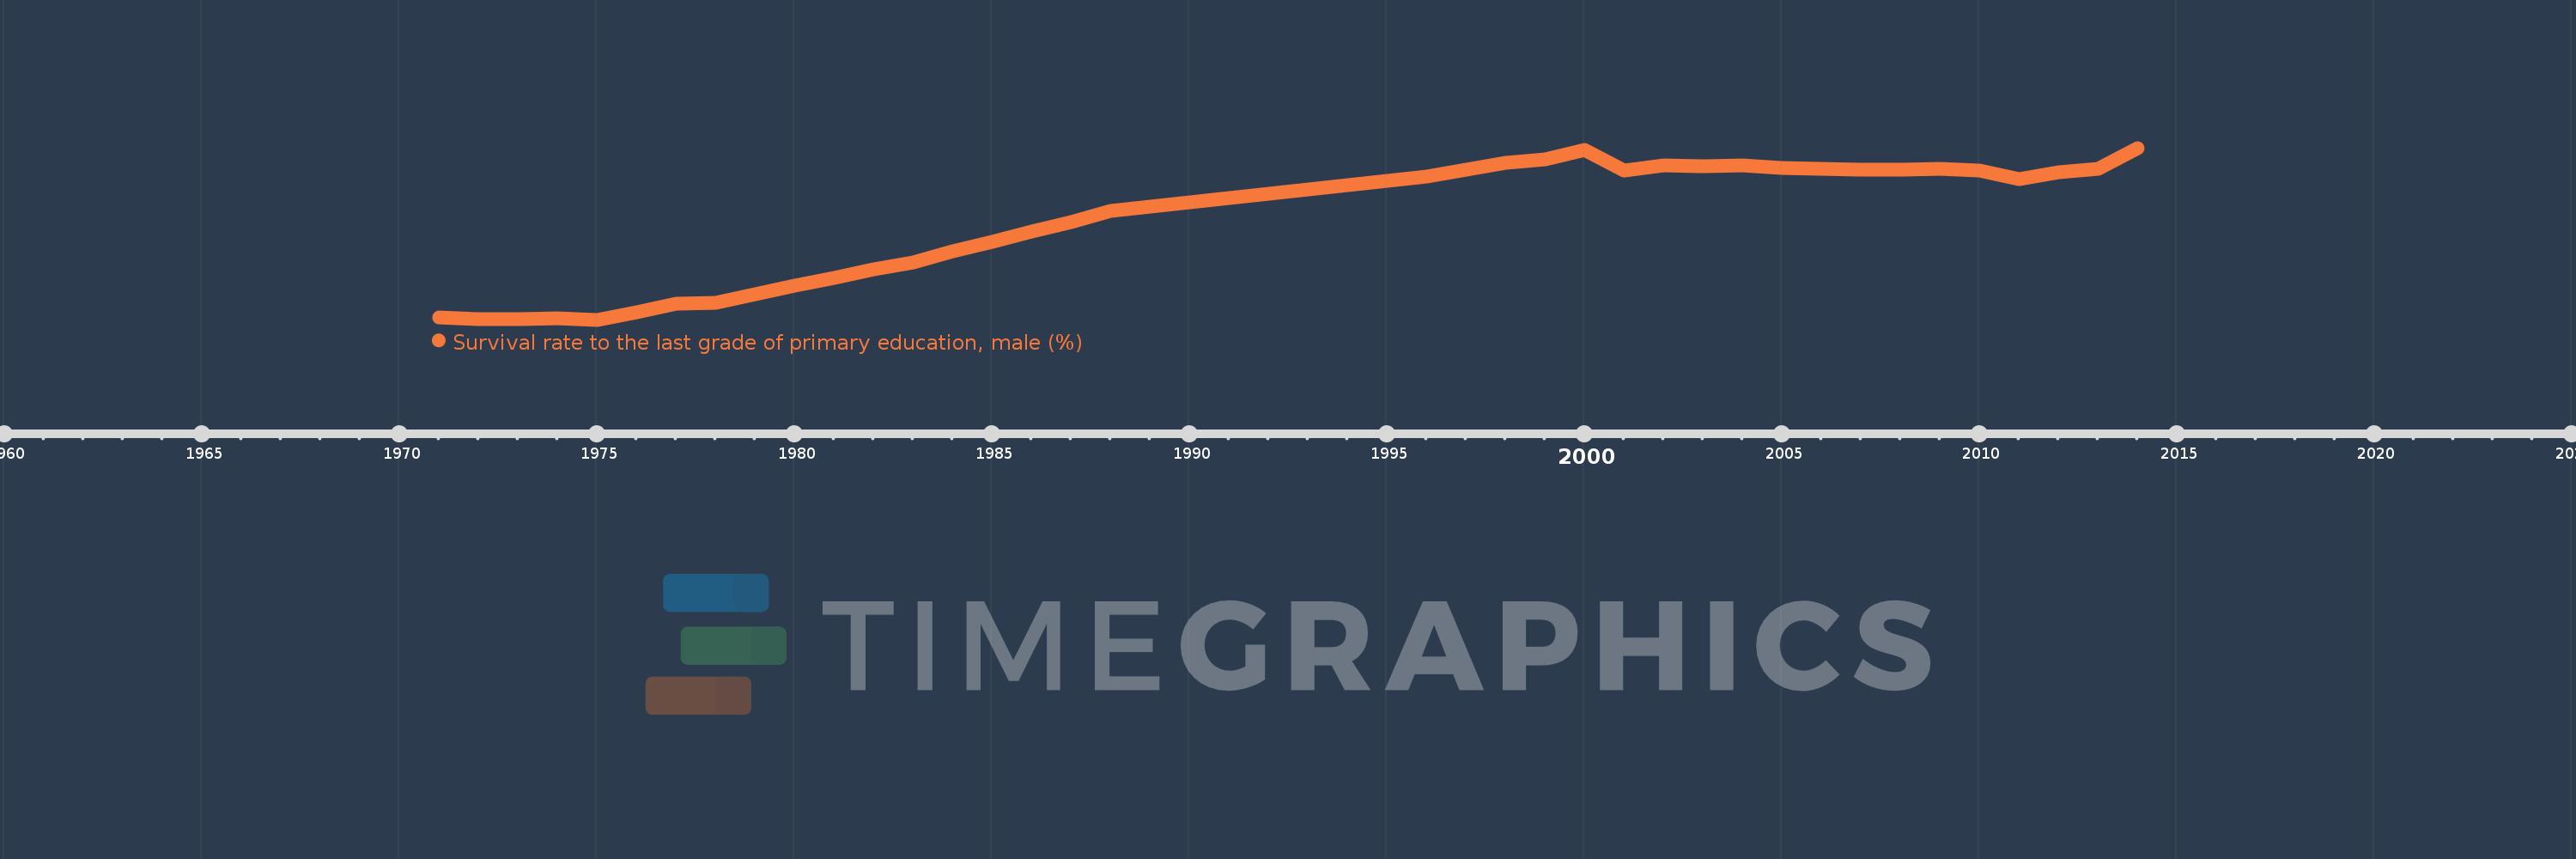
Survival rate to the last grade of primary education, male (%)
2014,2013,2012,2011,2010,2009,2008,2007,2006,2005,2004,2003,2002,2001,2000,1999,1998,1997,1996,1995,1994,1993,1992,1991,1990,1989,1988,1987,1986,1985,1984,1983,1982,1981,1980,1979,1978,1977,1976,1975,1974,1973,1972,1971
This statistics in other country:
AfghanistanAlbaniaAlgeriaAndorraAngolaArab WorldArgentinaArmeniaArubaAustriaAzerbaijanBahamas, TheBahrainBangladeshBarbadosBelarusBelgiumBelizeBeninBermudaBhutanBoliviaBosnia and HerzegovinaBotswanaBrazilBrunei DarussalamBulgariaBurkina FasoBurundiCabo VerdeCambodiaCameroonCanadaCaribbean small statesCentral African RepublicCentral Europe and the BalticsChadChileChinaColombiaComorosCongo, Dem. Rep.Congo, Rep.Costa RicaCote d'IvoireCroatiaCubaCyprusCzech RepublicDenmarkDjiboutiDominicaDominican RepublicEarly-demographic dividendEast Asia & PacificEast Asia & Pacific (excluding high income)East Asia & Pacific (IDA & IBRD countries)EcuadorEgypt, Arab Rep.El SalvadorEquatorial GuineaEritreaEstoniaEthiopiaEuro areaEurope & Central AsiaEurope & Central Asia (excluding high income)Europe & Central Asia (IDA & IBRD countries)European UnionFijiFinlandFragile and conflict affected situationsFranceGabonGambia, TheGeorgiaGermanyGhanaGreeceGuatemalaGuineaGuinea-BissauGuyanaHaitiHeavily indebted poor countries (HIPC)High incomeHondurasHong Kong SAR, ChinaHungaryIBRD onlyIcelandIDA & IBRD totalIDA blendIDA onlyIDA totalIndiaIndonesiaIran, Islamic Rep.IraqIsraelItalyJamaicaJapanJordanKazakhstanKenyaKiribatiKorea, Rep.KuwaitKyrgyz RepublicLao PDRLate-demographic dividendLatin America & Caribbean Latin America & Caribbean (excluding high income)Latin America & the Caribbean (IDA & IBRD countries)LatviaLeast developed countries: UN classificationLebanonLesothoLiberiaLibyaLiechtensteinLithuaniaLow & middle incomeLow incomeLower middle incomeLuxembourgMacao SAR, ChinaMacedonia, FYRMadagascarMalawiMalaysiaMaldivesMaliMaltaMarshall IslandsMauritaniaMauritiusMexicoMiddle East & North AfricaMiddle East & North Africa (excluding high income)Middle East & North Africa (IDA & IBRD countries)Middle incomeMoldovaMongoliaMontenegroMoroccoMozambiqueMyanmarNamibiaNepalNetherlandsNicaraguaNigerNigeriaNorth AmericaNorwayOECD membersOmanOther small statesPacific island small statesPakistanPanamaPapua New GuineaParaguayPeruPhilippinesPolandPortugalPost-demographic dividendPre-demographic dividendQatarRomaniaRussian FederationRwandaSamoaSan MarinoSao Tome and PrincipeSaudi ArabiaSenegalSerbiaSeychellesSierra LeoneSingaporeSlovak RepublicSloveniaSmall statesSolomon IslandsSouth AfricaSouth AsiaSouth Asia (IDA & IBRD)SpainSri LankaSt. Kitts and NevisSt. LuciaSt. Vincent and the GrenadinesSub-Saharan Africa Sub-Saharan Africa (excluding high income)Sub-Saharan Africa (IDA & IBRD countries)SudanSurinameSwazilandSwedenSwitzerlandSyrian Arab RepublicTajikistanTanzaniaThailandTimor-LesteTogoTongaTrinidad and TobagoTunisiaTurkeyUgandaUkraineUnited Arab EmiratesUpper middle incomeUruguayUzbekistanVanuatuVenezuela, RBVietnamWest Bank and GazaWorldYemen, Rep.ZambiaZimbabwe Timeline:
This timeline shows a graph from 1971 to 2014 of South Asia (IDA & IBRD). No data until 1970. Number of actual observations by date: 44.
Source name:
World Development Indicators
Source organization:
UNESCO Institute for Statistics
Categories, topics:
Education, Gender
Last updated:
apr 23, 2017
Indicators value changes by year
Maximum:
64.248
jan 1, 2014
At the date of observation
Value
Absolute change
Change from previous value
jan 1, 1971
41.729
+41.729
0.0%
jan 1, 1972
41.426
-0.303
-0.73%
jan 1, 1973
41.432
+0.006
0.01%
jan 1, 1974
41.517
+0.085
0.2%
jan 1, 1975
41.37
-0.146
-0.35%
jan 1, 1976
42.378
+1.008
2.44%
jan 1, 1977
43.478
+1.1
2.6%
jan 1, 1978
43.637
+0.159
0.37%
jan 1, 1979
44.797
+1.159
2.66%
jan 1, 1980
45.945
+1.149
2.56%
jan 1, 1981
46.913
+0.968
2.11%
jan 1, 1982
48.12
+1.207
2.57%
jan 1, 1983
49.056
+0.936
1.94%
jan 1, 1984
50.451
+1.395
2.84%
jan 1, 1985
51.796
+1.344
2.66%
jan 1, 1986
53.12
+1.325
2.56%
jan 1, 1987
54.399
+1.279
2.41%
jan 1, 1988
55.882
+1.482
2.72%
jan 1, 1989
56.427
+0.546
0.98%
jan 1, 1990
57.05
+0.623
1.1%
jan 1, 1991
57.628
+0.579
1.01%
jan 1, 1992
58.19
+0.562
0.98%
jan 1, 1993
58.741
+0.551
0.95%
jan 1, 1994
59.325
+0.584
0.99%
jan 1, 1995
59.838
+0.513
0.87%
jan 1, 1996
60.39
+0.552
0.92%
jan 1, 1997
61.351
+0.961
1.59%
jan 1, 1998
62.256
+0.905
1.48%
jan 1, 1999
62.726
+0.469
0.75%
jan 1, 2000
64.004
+1.278
2.04%
jan 1, 2001
61.26
-2.744
-4.29%
jan 1, 2002
61.898
+0.638
1.04%
jan 1, 2003
61.852
-0.046
-0.07%
jan 1, 2004
61.882
+0.03
0.05%
jan 1, 2005
61.591
-0.291
-0.47%
jan 1, 2006
61.467
-0.124
-0.2%
jan 1, 2007
61.379
-0.088
-0.14%
jan 1, 2008
61.384
+0.004
0.01%
jan 1, 2009
61.453
+0.069
0.11%
jan 1, 2010
61.222
-0.23
-0.37%
jan 1, 2011
60.113
-1.109
-1.81%
jan 1, 2012
60.975
+0.862
1.43%
jan 1, 2013
61.415
+0.44
0.72%
jan 1, 2014
64.248
+2.833
4.61%
Ranking of countries by current statistics by years


Comments: