29
/
en
AIzaSyAYiBZKx7MnpbEhh9jyipgxe19OcubqV5w
April 1, 2024
124245
Ecuador
ECU
true
2
1
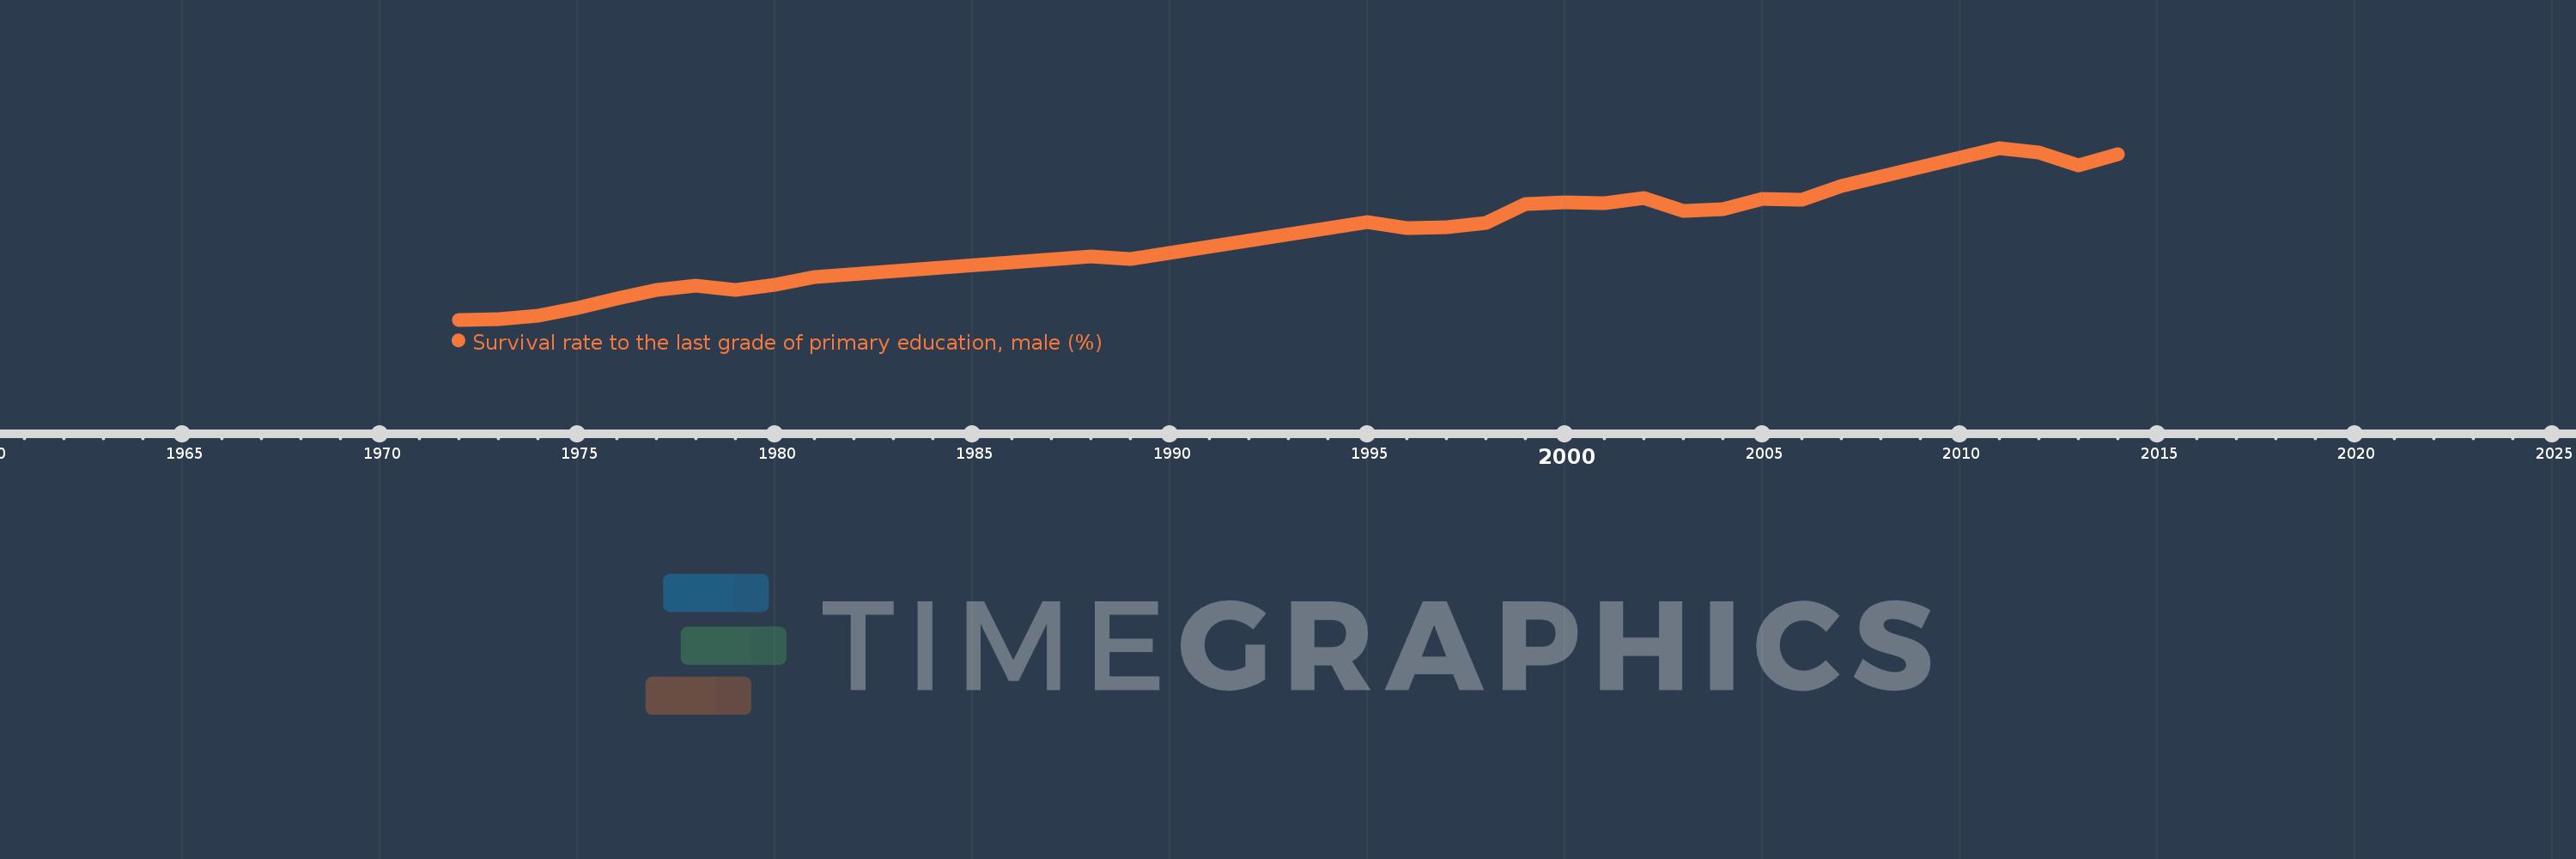
Survival rate to the last grade of primary education, male (%)
2014,2013,2012,2011,2007,2006,2005,2004,2003,2002,2001,2000,1999,1998,1997,1996,1995,1989,1988,1981,1980,1979,1978,1977,1976,1975,1974,1973,1972
This statistics in other country:
AfghanistanAlbaniaAlgeriaAndorraAngolaArab WorldArgentinaArmeniaArubaAustriaAzerbaijanBahamas, TheBahrainBangladeshBarbadosBelarusBelgiumBelizeBeninBermudaBhutanBoliviaBosnia and HerzegovinaBotswanaBrazilBrunei DarussalamBulgariaBurkina FasoBurundiCabo VerdeCambodiaCameroonCanadaCaribbean small statesCentral African RepublicCentral Europe and the BalticsChadChileChinaColombiaComorosCongo, Dem. Rep.Congo, Rep.Costa RicaCote d'IvoireCroatiaCubaCyprusCzech RepublicDenmarkDjiboutiDominicaDominican RepublicEarly-demographic dividendEast Asia & PacificEast Asia & Pacific (excluding high income)East Asia & Pacific (IDA & IBRD countries)EcuadorEgypt, Arab Rep.El SalvadorEquatorial GuineaEritreaEstoniaEthiopiaEuro areaEurope & Central AsiaEurope & Central Asia (excluding high income)Europe & Central Asia (IDA & IBRD countries)European UnionFijiFinlandFragile and conflict affected situationsFranceGabonGambia, TheGeorgiaGermanyGhanaGreeceGuatemalaGuineaGuinea-BissauGuyanaHaitiHeavily indebted poor countries (HIPC)High incomeHondurasHong Kong SAR, ChinaHungaryIBRD onlyIcelandIDA & IBRD totalIDA blendIDA onlyIDA totalIndiaIndonesiaIran, Islamic Rep.IraqIsraelItalyJamaicaJapanJordanKazakhstanKenyaKiribatiKorea, Rep.KuwaitKyrgyz RepublicLao PDRLate-demographic dividendLatin America & Caribbean Latin America & Caribbean (excluding high income)Latin America & the Caribbean (IDA & IBRD countries)LatviaLeast developed countries: UN classificationLebanonLesothoLiberiaLibyaLiechtensteinLithuaniaLow & middle incomeLow incomeLower middle incomeLuxembourgMacao SAR, ChinaMacedonia, FYRMadagascarMalawiMalaysiaMaldivesMaliMaltaMarshall IslandsMauritaniaMauritiusMexicoMiddle East & North AfricaMiddle East & North Africa (excluding high income)Middle East & North Africa (IDA & IBRD countries)Middle incomeMoldovaMongoliaMontenegroMoroccoMozambiqueMyanmarNamibiaNepalNetherlandsNicaraguaNigerNigeriaNorth AmericaNorwayOECD membersOmanOther small statesPacific island small statesPakistanPanamaPapua New GuineaParaguayPeruPhilippinesPolandPortugalPost-demographic dividendPre-demographic dividendQatarRomaniaRussian FederationRwandaSamoaSan MarinoSao Tome and PrincipeSaudi ArabiaSenegalSerbiaSeychellesSierra LeoneSingaporeSlovak RepublicSloveniaSmall statesSolomon IslandsSouth AfricaSouth AsiaSouth Asia (IDA & IBRD)SpainSri LankaSt. Kitts and NevisSt. LuciaSt. Vincent and the GrenadinesSub-Saharan Africa Sub-Saharan Africa (excluding high income)Sub-Saharan Africa (IDA & IBRD countries)SudanSurinameSwazilandSwedenSwitzerlandSyrian Arab RepublicTajikistanTanzaniaThailandTimor-LesteTogoTongaTrinidad and TobagoTunisiaTurkeyUgandaUkraineUnited Arab EmiratesUpper middle incomeUruguayUzbekistanVanuatuVenezuela, RBVietnamWest Bank and GazaWorldYemen, Rep.ZambiaZimbabwe Timeline:
This timeline shows a graph from 1972 to 2014 of Ecuador. No data until 1971. Number of actual observations by date: 29.
Source name:
World Development Indicators
Source organization:
UNESCO Institute for Statistics
Categories, topics:
Education, Gender
Last updated:
apr 23, 2017
Indicators value changes by year
Minimum:
37.178
jan 1, 1972
Maximum:
91.341
jan 1, 2011
At the date of observation
Value
Absolute change
Change from previous value
jan 1, 1972
37.178
+37.178
0.0%
jan 1, 1973
37.269
+0.09
0.24%
jan 1, 1974
38.429
+1.161
3.11%
jan 1, 1975
40.936
+2.507
6.52%
jan 1, 1976
43.848
+2.912
7.11%
jan 1, 1977
46.555
+2.707
6.17%
jan 1, 1978
47.851
+1.297
2.79%
jan 1, 1979
46.636
-1.215
-2.54%
jan 1, 1980
48.318
+1.682
3.61%
jan 1, 1981
50.712
+2.393
4.95%
jan 1, 1988
57.065
+6.353
12.53%
jan 1, 1989
56.292
-0.773
-1.35%
jan 1, 1995
67.931
+11.639
20.68%
jan 1, 1996
66.139
-1.792
-2.64%
jan 1, 1997
66.294
+0.155
0.23%
jan 1, 1998
67.69
+1.396
2.11%
jan 1, 1999
73.628
+5.938
8.77%
jan 1, 2000
74.318
+0.69
0.94%
jan 1, 2001
73.964
-0.354
-0.48%
jan 1, 2002
75.644
+1.68
2.27%
jan 1, 2003
71.448
-4.196
-5.55%
jan 1, 2004
71.989
+0.541
0.76%
jan 1, 2005
75.279
+3.29
4.57%
jan 1, 2006
74.952
-0.326
-0.43%
jan 1, 2007
79.214
+4.261
5.69%
jan 1, 2011
91.341
+12.127
15.31%
jan 1, 2012
89.789
-1.552
-1.7%
jan 1, 2013
85.883
-3.906
-4.35%
jan 1, 2014
89.303
+3.42
3.98%
Ranking of countries by current statistics by years


Comments: