30
/
AIzaSyAYiBZKx7MnpbEhh9jyipgxe19OcubqV5w
April 1, 2024
212408
Niger
NER
true
2
1
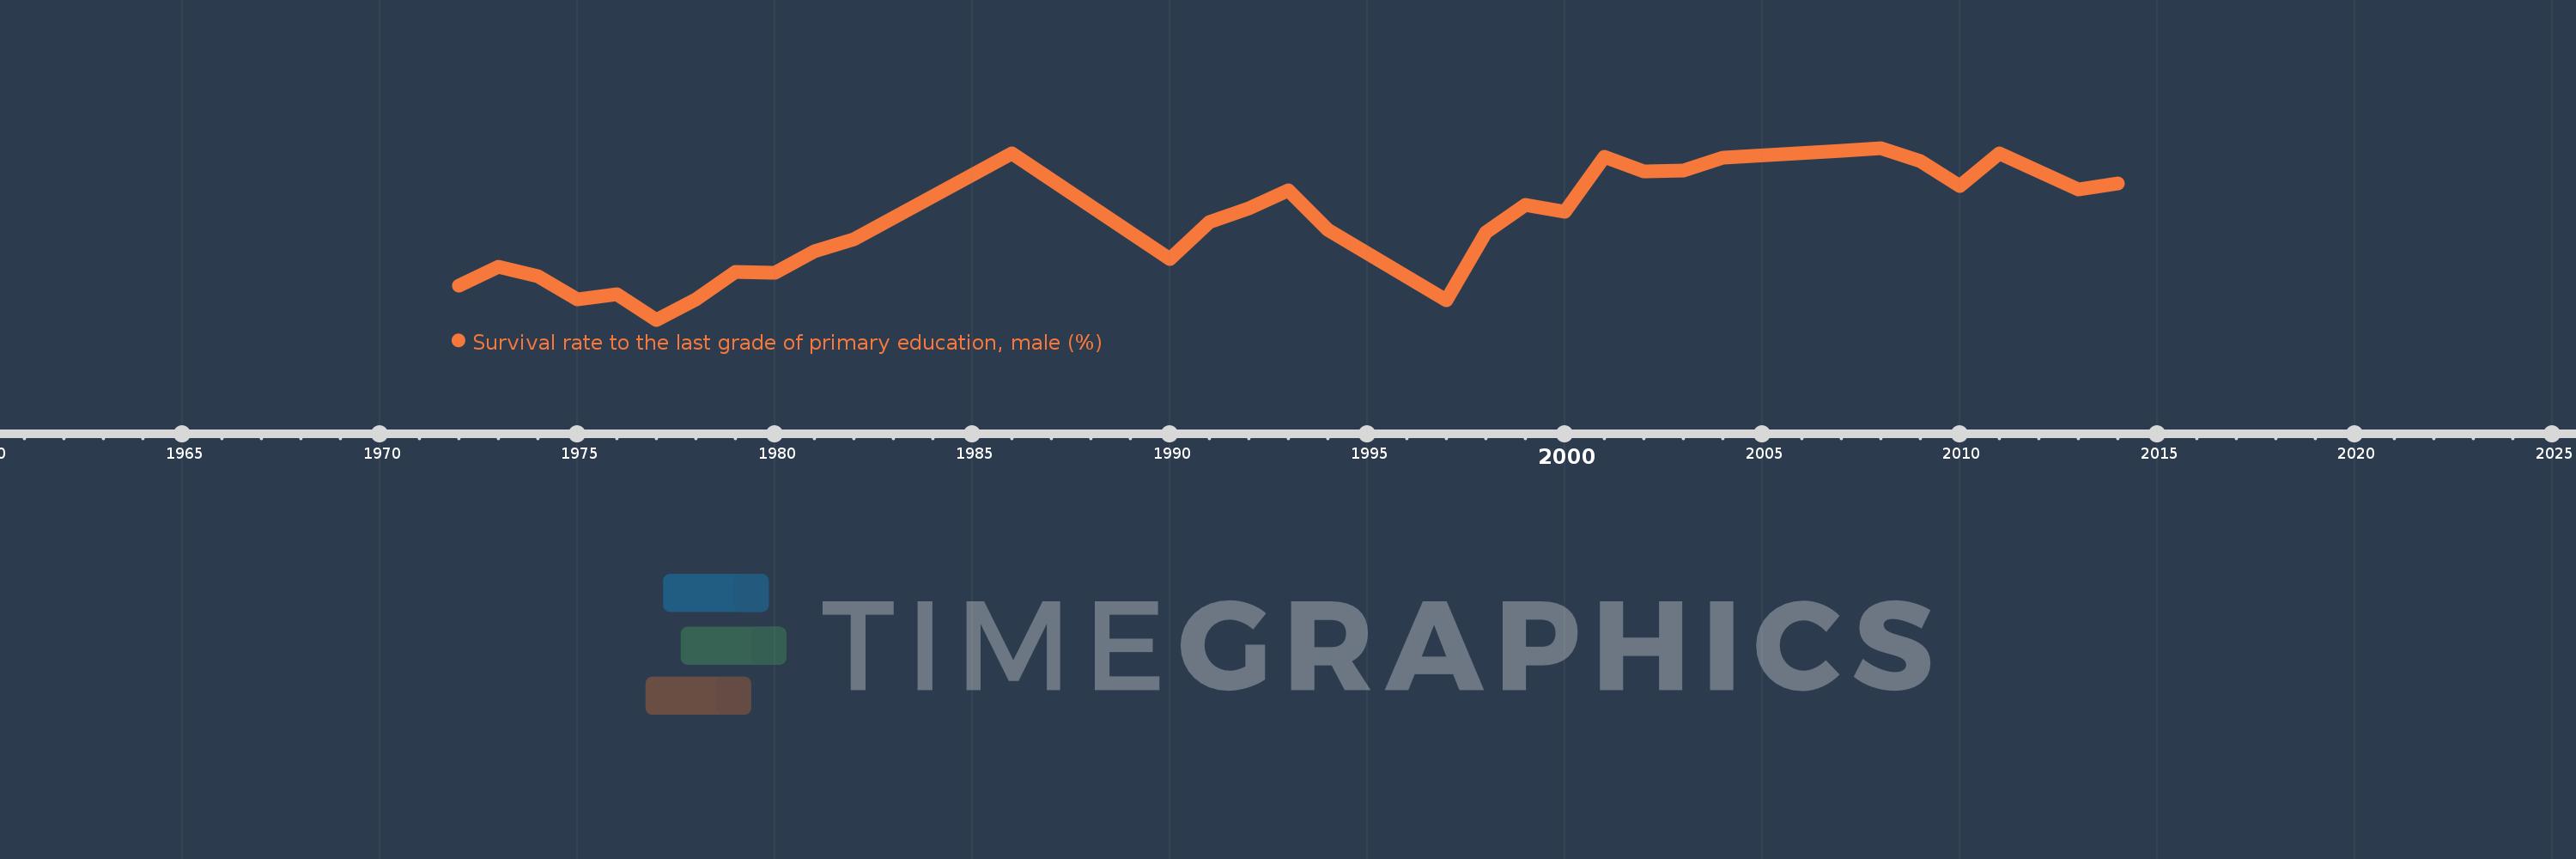
Survival rate to the last grade of primary education, male (%)
2014,2013,2011,2010,2009,2008,2007,2004,2003,2002,2001,2000,1999,1998,1997,1994,1993,1992,1991,1990,1986,1982,1981,1980,1979,1978,1977,1976,1975,1974,1973,1972
