29
/
en
AIzaSyAYiBZKx7MnpbEhh9jyipgxe19OcubqV5w
April 1, 2024
47759
Lower middle income
LMC
false
2
1
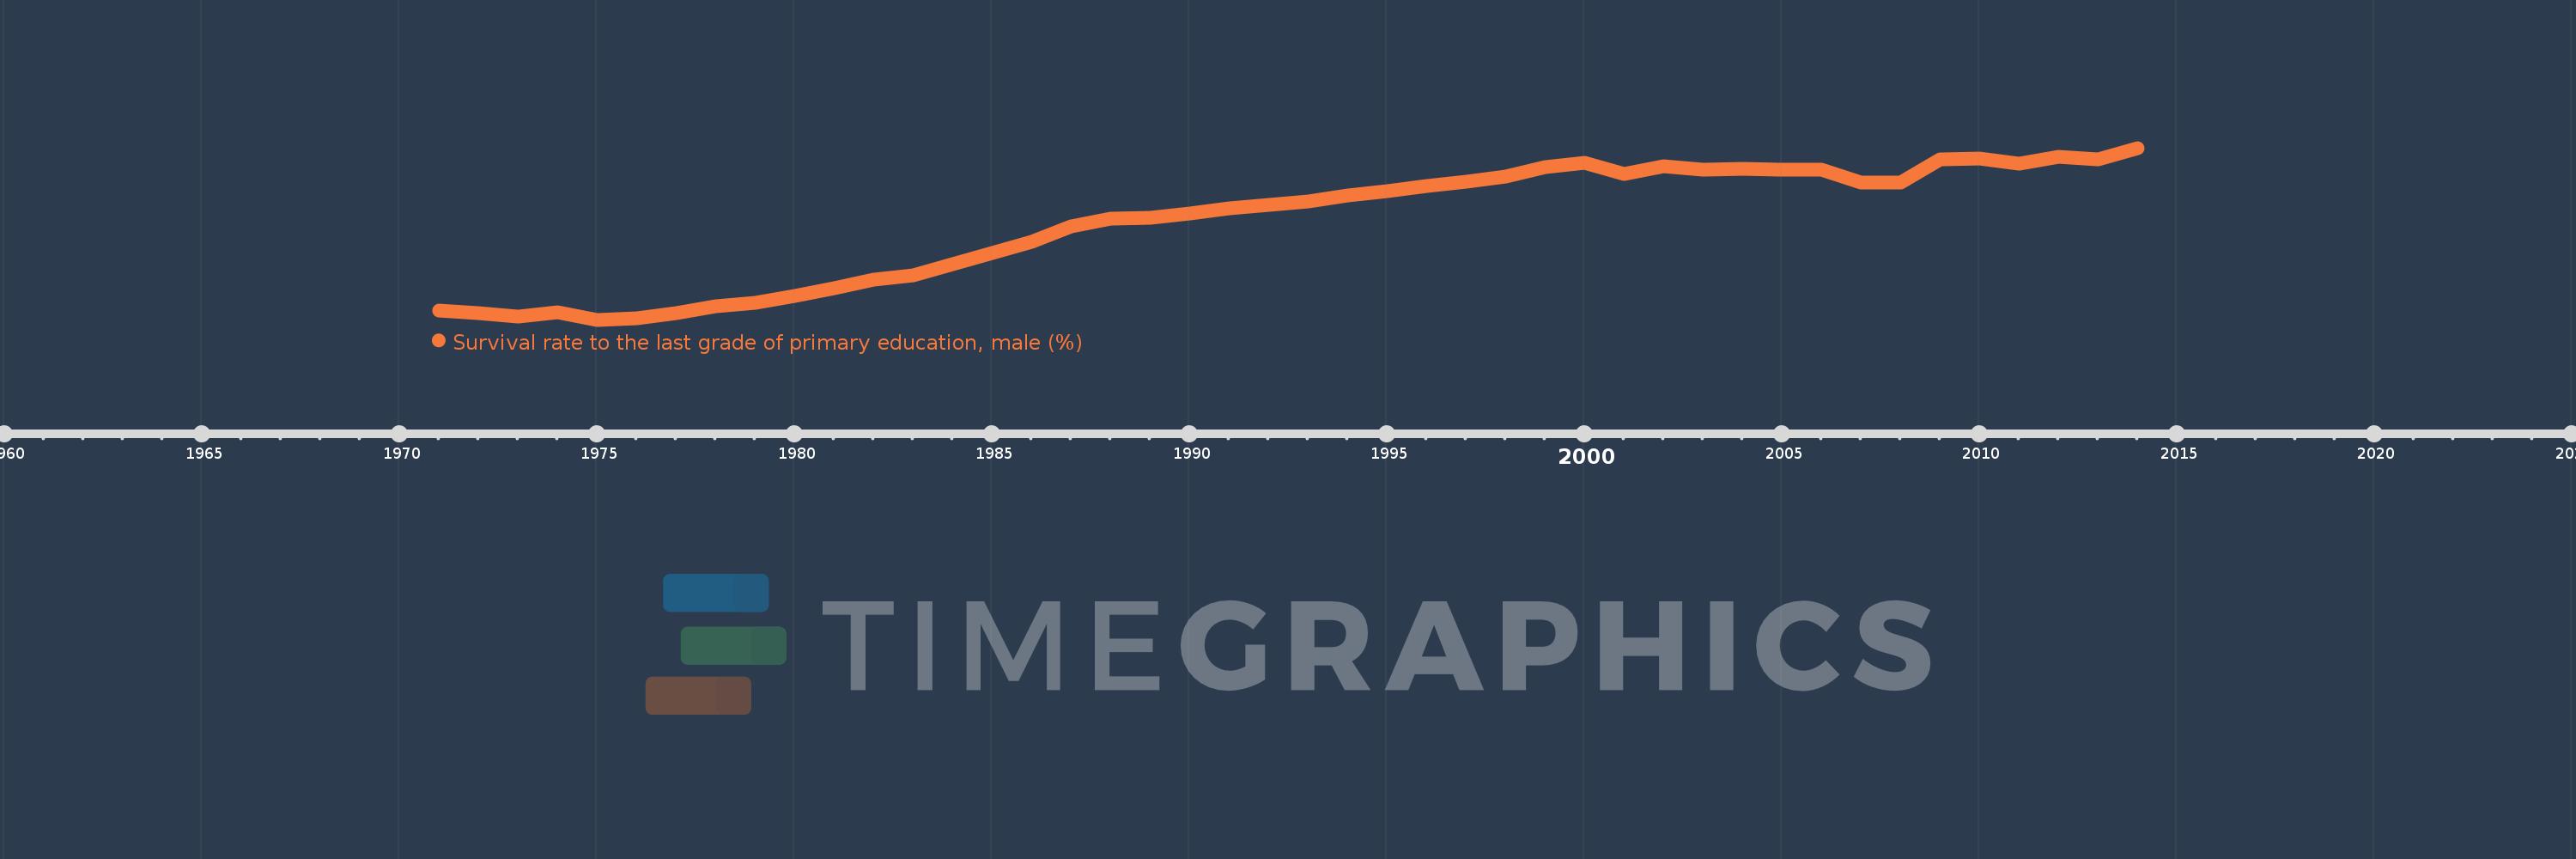
Survival rate to the last grade of primary education, male (%)
2014,2013,2012,2011,2010,2009,2008,2007,2006,2005,2004,2003,2002,2001,2000,1999,1998,1997,1996,1995,1994,1993,1992,1991,1990,1989,1988,1987,1986,1985,1984,1983,1982,1981,1980,1979,1978,1977,1976,1975,1974,1973,1972,1971
This statistics in other country:
AfghanistanAlbaniaAlgeriaAndorraAngolaArab WorldArgentinaArmeniaArubaAustriaAzerbaijanBahamas, TheBahrainBangladeshBarbadosBelarusBelgiumBelizeBeninBermudaBhutanBoliviaBosnia and HerzegovinaBotswanaBrazilBrunei DarussalamBulgariaBurkina FasoBurundiCabo VerdeCambodiaCameroonCanadaCaribbean small statesCentral African RepublicCentral Europe and the BalticsChadChileChinaColombiaComorosCongo, Dem. Rep.Congo, Rep.Costa RicaCote d'IvoireCroatiaCubaCyprusCzech RepublicDenmarkDjiboutiDominicaDominican RepublicEarly-demographic dividendEast Asia & PacificEast Asia & Pacific (excluding high income)East Asia & Pacific (IDA & IBRD countries)EcuadorEgypt, Arab Rep.El SalvadorEquatorial GuineaEritreaEstoniaEthiopiaEuro areaEurope & Central AsiaEurope & Central Asia (excluding high income)Europe & Central Asia (IDA & IBRD countries)European UnionFijiFinlandFragile and conflict affected situationsFranceGabonGambia, TheGeorgiaGermanyGhanaGreeceGuatemalaGuineaGuinea-BissauGuyanaHaitiHeavily indebted poor countries (HIPC)High incomeHondurasHong Kong SAR, ChinaHungaryIBRD onlyIcelandIDA & IBRD totalIDA blendIDA onlyIDA totalIndiaIndonesiaIran, Islamic Rep.IraqIsraelItalyJamaicaJapanJordanKazakhstanKenyaKiribatiKorea, Rep.KuwaitKyrgyz RepublicLao PDRLate-demographic dividendLatin America & Caribbean Latin America & Caribbean (excluding high income)Latin America & the Caribbean (IDA & IBRD countries)LatviaLeast developed countries: UN classificationLebanonLesothoLiberiaLibyaLiechtensteinLithuaniaLow & middle incomeLow incomeLower middle incomeLuxembourgMacao SAR, ChinaMacedonia, FYRMadagascarMalawiMalaysiaMaldivesMaliMaltaMarshall IslandsMauritaniaMauritiusMexicoMiddle East & North AfricaMiddle East & North Africa (excluding high income)Middle East & North Africa (IDA & IBRD countries)Middle incomeMoldovaMongoliaMontenegroMoroccoMozambiqueMyanmarNamibiaNepalNetherlandsNicaraguaNigerNigeriaNorth AmericaNorwayOECD membersOmanOther small statesPacific island small statesPakistanPanamaPapua New GuineaParaguayPeruPhilippinesPolandPortugalPost-demographic dividendPre-demographic dividendQatarRomaniaRussian FederationRwandaSamoaSan MarinoSao Tome and PrincipeSaudi ArabiaSenegalSerbiaSeychellesSierra LeoneSingaporeSlovak RepublicSloveniaSmall statesSolomon IslandsSouth AfricaSouth AsiaSouth Asia (IDA & IBRD)SpainSri LankaSt. Kitts and NevisSt. LuciaSt. Vincent and the GrenadinesSub-Saharan Africa Sub-Saharan Africa (excluding high income)Sub-Saharan Africa (IDA & IBRD countries)SudanSurinameSwazilandSwedenSwitzerlandSyrian Arab RepublicTajikistanTanzaniaThailandTimor-LesteTogoTongaTrinidad and TobagoTunisiaTurkeyUgandaUkraineUnited Arab EmiratesUpper middle incomeUruguayUzbekistanVanuatuVenezuela, RBVietnamWest Bank and GazaWorldYemen, Rep.ZambiaZimbabwe Timeline:
This timeline shows a graph from 1971 to 2014 of Lower middle income. No data until 1970. Number of actual observations by date: 44.
Source name:
World Development Indicators
Source organization:
UNESCO Institute for Statistics
Categories, topics:
Education, Gender
Last updated:
apr 23, 2017
Indicators value changes by year
Minimum:
47.778
jan 1, 1975
Maximum:
70.244
jan 1, 2014
At the date of observation
Value
Absolute change
Change from previous value
jan 1, 1971
48.987
+48.987
0.0%
jan 1, 1972
48.645
-0.341
-0.7%
jan 1, 1973
48.225
-0.42
-0.86%
jan 1, 1974
48.773
+0.548
1.14%
jan 1, 1975
47.778
-0.995
-2.04%
jan 1, 1976
47.992
+0.214
0.45%
jan 1, 1977
48.614
+0.622
1.3%
jan 1, 1978
49.545
+0.931
1.91%
jan 1, 1979
50.044
+0.499
1.01%
jan 1, 1980
50.914
+0.87
1.74%
jan 1, 1981
51.867
+0.952
1.87%
jan 1, 1982
53.07
+1.204
2.32%
jan 1, 1983
53.624
+0.553
1.04%
jan 1, 1984
55.086
+1.462
2.73%
jan 1, 1985
56.518
+1.431
2.6%
jan 1, 1986
57.933
+1.416
2.5%
jan 1, 1987
59.979
+2.046
3.53%
jan 1, 1988
60.972
+0.993
1.65%
jan 1, 1989
61.161
+0.189
0.31%
jan 1, 1990
61.727
+0.566
0.92%
jan 1, 1991
62.367
+0.64
1.04%
jan 1, 1992
62.759
+0.392
0.63%
jan 1, 1993
63.195
+0.436
0.69%
jan 1, 1994
63.979
+0.785
1.24%
jan 1, 1995
64.635
+0.655
1.02%
jan 1, 1996
65.247
+0.613
0.95%
jan 1, 1997
65.874
+0.627
0.96%
jan 1, 1998
66.537
+0.663
1.01%
jan 1, 1999
67.7
+1.163
1.75%
jan 1, 2000
68.305
+0.605
0.89%
jan 1, 2001
66.838
-1.468
-2.15%
jan 1, 2002
67.872
+1.034
1.55%
jan 1, 2003
67.407
-0.465
-0.69%
jan 1, 2004
67.477
+0.07
0.1%
jan 1, 2005
67.409
-0.068
-0.1%
jan 1, 2006
67.355
-0.054
-0.08%
jan 1, 2007
65.688
-1.666
-2.47%
jan 1, 2008
65.705
+0.017
0.03%
jan 1, 2009
68.712
+3.007
4.58%
jan 1, 2010
68.836
+0.124
0.18%
jan 1, 2011
68.215
-0.621
-0.9%
jan 1, 2012
69.07
+0.855
1.25%
jan 1, 2013
68.779
-0.291
-0.42%
jan 1, 2014
70.244
+1.465
2.13%
Ranking of countries by current statistics by years


Comments: