29
/
en
AIzaSyAYiBZKx7MnpbEhh9jyipgxe19OcubqV5w
April 1, 2024
25345
Caribbean small states
CSS
false
2
1
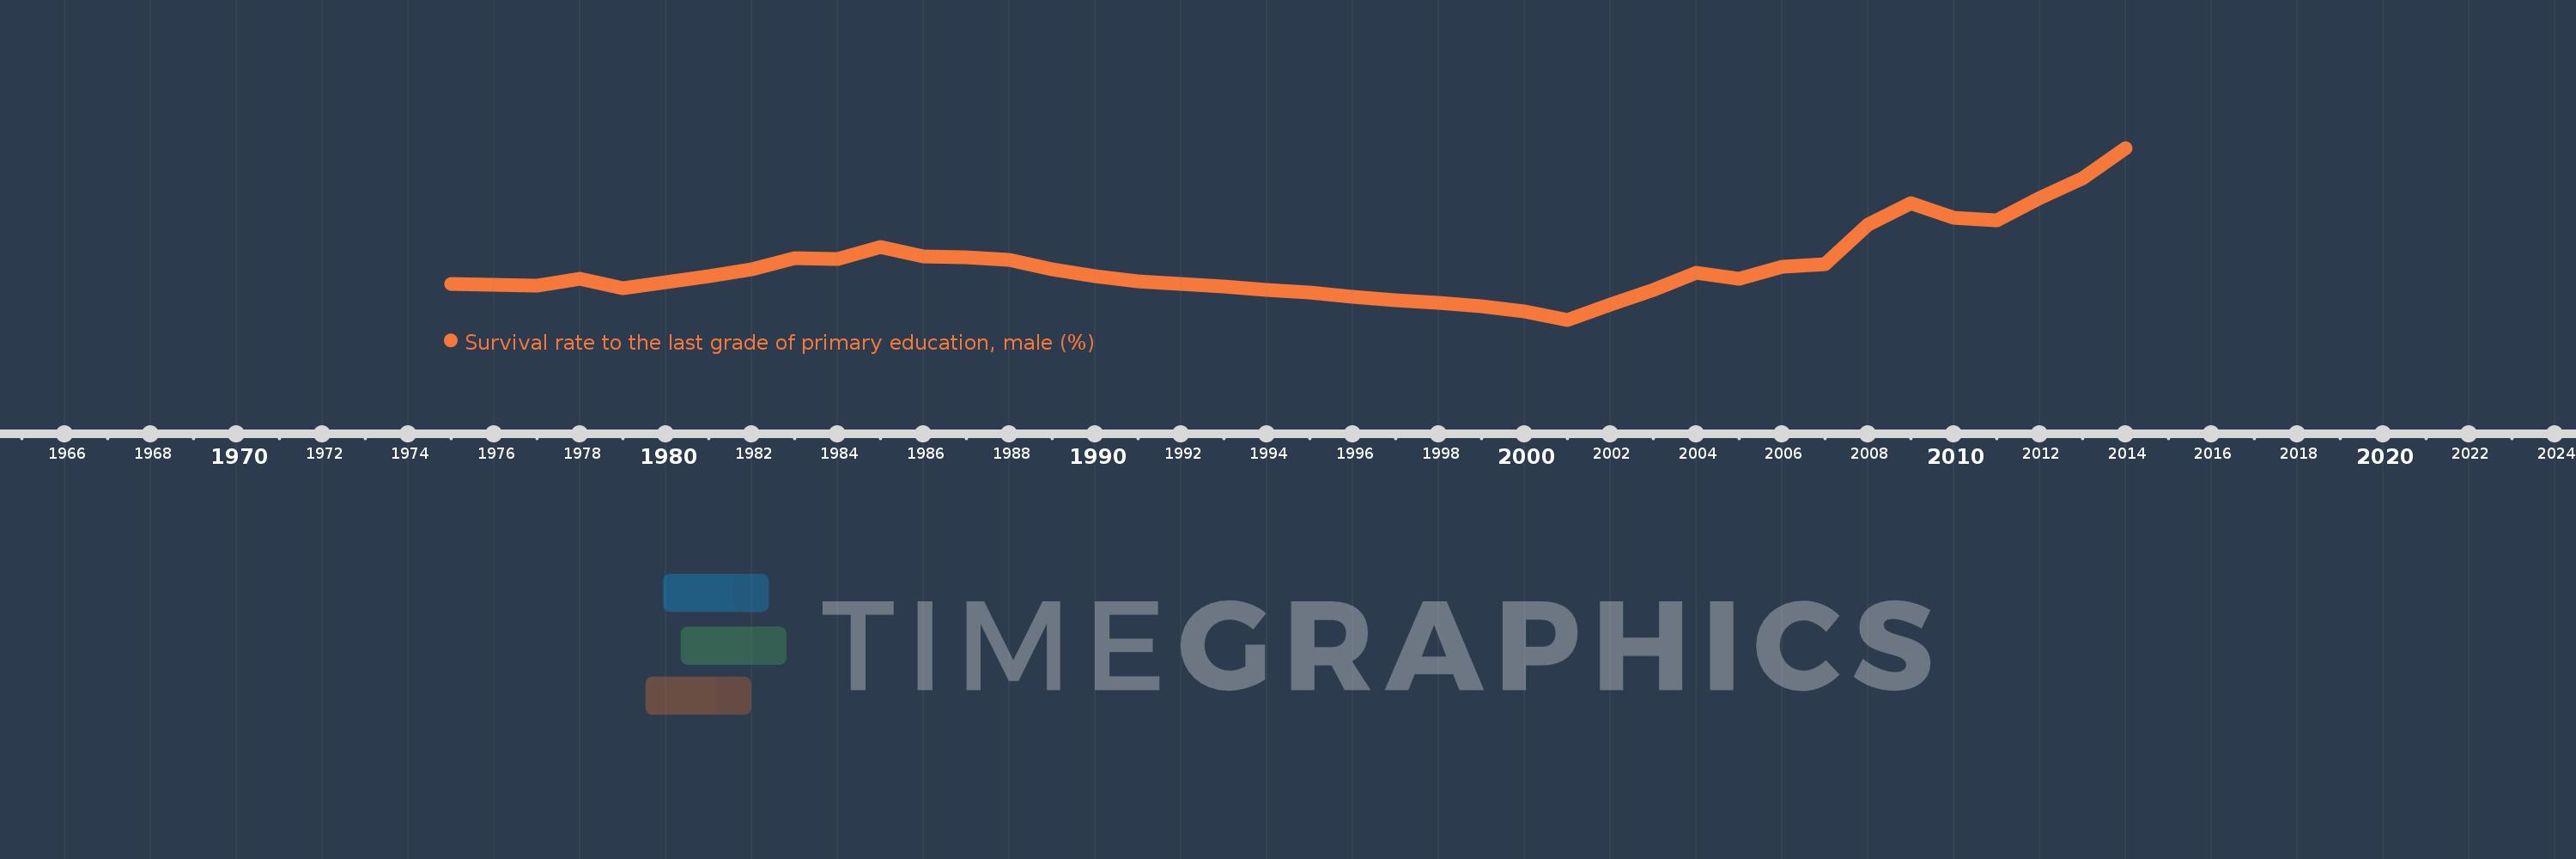
Survival rate to the last grade of primary education, male (%)
2014,2013,2012,2011,2010,2009,2008,2007,2006,2005,2004,2003,2002,2001,2000,1999,1998,1997,1996,1995,1994,1993,1992,1991,1990,1989,1988,1987,1986,1985,1984,1983,1982,1981,1980,1979,1978,1977,1976,1975
This statistics in other country:
AfghanistanAlbaniaAlgeriaAndorraAngolaArab WorldArgentinaArmeniaArubaAustriaAzerbaijanBahamas, TheBahrainBangladeshBarbadosBelarusBelgiumBelizeBeninBermudaBhutanBoliviaBosnia and HerzegovinaBotswanaBrazilBrunei DarussalamBulgariaBurkina FasoBurundiCabo VerdeCambodiaCameroonCanadaCaribbean small statesCentral African RepublicCentral Europe and the BalticsChadChileChinaColombiaComorosCongo, Dem. Rep.Congo, Rep.Costa RicaCote d'IvoireCroatiaCubaCyprusCzech RepublicDenmarkDjiboutiDominicaDominican RepublicEarly-demographic dividendEast Asia & PacificEast Asia & Pacific (excluding high income)East Asia & Pacific (IDA & IBRD countries)EcuadorEgypt, Arab Rep.El SalvadorEquatorial GuineaEritreaEstoniaEthiopiaEuro areaEurope & Central AsiaEurope & Central Asia (excluding high income)Europe & Central Asia (IDA & IBRD countries)European UnionFijiFinlandFragile and conflict affected situationsFranceGabonGambia, TheGeorgiaGermanyGhanaGreeceGuatemalaGuineaGuinea-BissauGuyanaHaitiHeavily indebted poor countries (HIPC)High incomeHondurasHong Kong SAR, ChinaHungaryIBRD onlyIcelandIDA & IBRD totalIDA blendIDA onlyIDA totalIndiaIndonesiaIran, Islamic Rep.IraqIsraelItalyJamaicaJapanJordanKazakhstanKenyaKiribatiKorea, Rep.KuwaitKyrgyz RepublicLao PDRLate-demographic dividendLatin America & Caribbean Latin America & Caribbean (excluding high income)Latin America & the Caribbean (IDA & IBRD countries)LatviaLeast developed countries: UN classificationLebanonLesothoLiberiaLibyaLiechtensteinLithuaniaLow & middle incomeLow incomeLower middle incomeLuxembourgMacao SAR, ChinaMacedonia, FYRMadagascarMalawiMalaysiaMaldivesMaliMaltaMarshall IslandsMauritaniaMauritiusMexicoMiddle East & North AfricaMiddle East & North Africa (excluding high income)Middle East & North Africa (IDA & IBRD countries)Middle incomeMoldovaMongoliaMontenegroMoroccoMozambiqueMyanmarNamibiaNepalNetherlandsNicaraguaNigerNigeriaNorth AmericaNorwayOECD membersOmanOther small statesPacific island small statesPakistanPanamaPapua New GuineaParaguayPeruPhilippinesPolandPortugalPost-demographic dividendPre-demographic dividendQatarRomaniaRussian FederationRwandaSamoaSan MarinoSao Tome and PrincipeSaudi ArabiaSenegalSerbiaSeychellesSierra LeoneSingaporeSlovak RepublicSloveniaSmall statesSolomon IslandsSouth AfricaSouth AsiaSouth Asia (IDA & IBRD)SpainSri LankaSt. Kitts and NevisSt. LuciaSt. Vincent and the GrenadinesSub-Saharan Africa Sub-Saharan Africa (excluding high income)Sub-Saharan Africa (IDA & IBRD countries)SudanSurinameSwazilandSwedenSwitzerlandSyrian Arab RepublicTajikistanTanzaniaThailandTimor-LesteTogoTongaTrinidad and TobagoTunisiaTurkeyUgandaUkraineUnited Arab EmiratesUpper middle incomeUruguayUzbekistanVanuatuVenezuela, RBVietnamWest Bank and GazaWorldYemen, Rep.ZambiaZimbabwe Timeline:
This timeline shows a graph from 1975 to 2014 of Caribbean small states. No data until 1974. Number of actual observations by date: 40.
Source name:
World Development Indicators
Source organization:
UNESCO Institute for Statistics
Categories, topics:
Education, Gender
Last updated:
apr 23, 2017
Indicators value changes by year
Minimum:
77.644
jan 1, 2001
Maximum:
89.395
jan 1, 2014
At the date of observation
Value
Absolute change
Change from previous value
jan 1, 1975
80.07
+80.07
0.0%
jan 1, 1976
80.048
-0.021
-0.03%
jan 1, 1977
80.005
-0.044
-0.05%
jan 1, 1978
80.468
+0.463
0.58%
jan 1, 1979
79.772
-0.696
-0.87%
jan 1, 1980
80.233
+0.461
0.58%
jan 1, 1981
80.618
+0.385
0.48%
jan 1, 1982
81.075
+0.457
0.57%
jan 1, 1983
81.871
+0.796
0.98%
jan 1, 1984
81.816
-0.054
-0.07%
jan 1, 1985
82.612
+0.795
0.97%
jan 1, 1986
81.979
-0.633
-0.77%
jan 1, 1987
81.925
-0.053
-0.07%
jan 1, 1988
81.745
-0.18
-0.22%
jan 1, 1989
81.114
-0.632
-0.77%
jan 1, 1990
80.606
-0.507
-0.63%
jan 1, 1991
80.296
-0.31
-0.38%
jan 1, 1992
80.08
-0.216
-0.27%
jan 1, 1993
79.897
-0.183
-0.23%
jan 1, 1994
79.675
-0.222
-0.28%
jan 1, 1995
79.51
-0.165
-0.21%
jan 1, 1996
79.241
-0.269
-0.34%
jan 1, 1997
79.006
-0.235
-0.3%
jan 1, 1998
78.792
-0.214
-0.27%
jan 1, 1999
78.56
-0.233
-0.3%
jan 1, 2000
78.211
-0.348
-0.44%
jan 1, 2001
77.644
-0.567
-0.73%
jan 1, 2002
78.68
+1.035
1.33%
jan 1, 2003
79.699
+1.019
1.3%
jan 1, 2004
80.829
+1.13
1.42%
jan 1, 2005
80.437
-0.392
-0.49%
jan 1, 2006
81.255
+0.818
1.02%
jan 1, 2007
81.438
+0.183
0.22%
jan 1, 2008
84.132
+2.694
3.31%
jan 1, 2009
85.631
+1.499
1.78%
jan 1, 2010
84.615
-1.016
-1.19%
jan 1, 2011
84.425
-0.19
-0.22%
jan 1, 2012
85.977
+1.552
1.84%
jan 1, 2013
87.347
+1.369
1.59%
jan 1, 2014
89.395
+2.049
2.35%
Ranking of countries by current statistics by years


Comments: