29
/
en
AIzaSyAYiBZKx7MnpbEhh9jyipgxe19OcubqV5w
April 1, 2024
96074
Burundi
BDI
true
2
1
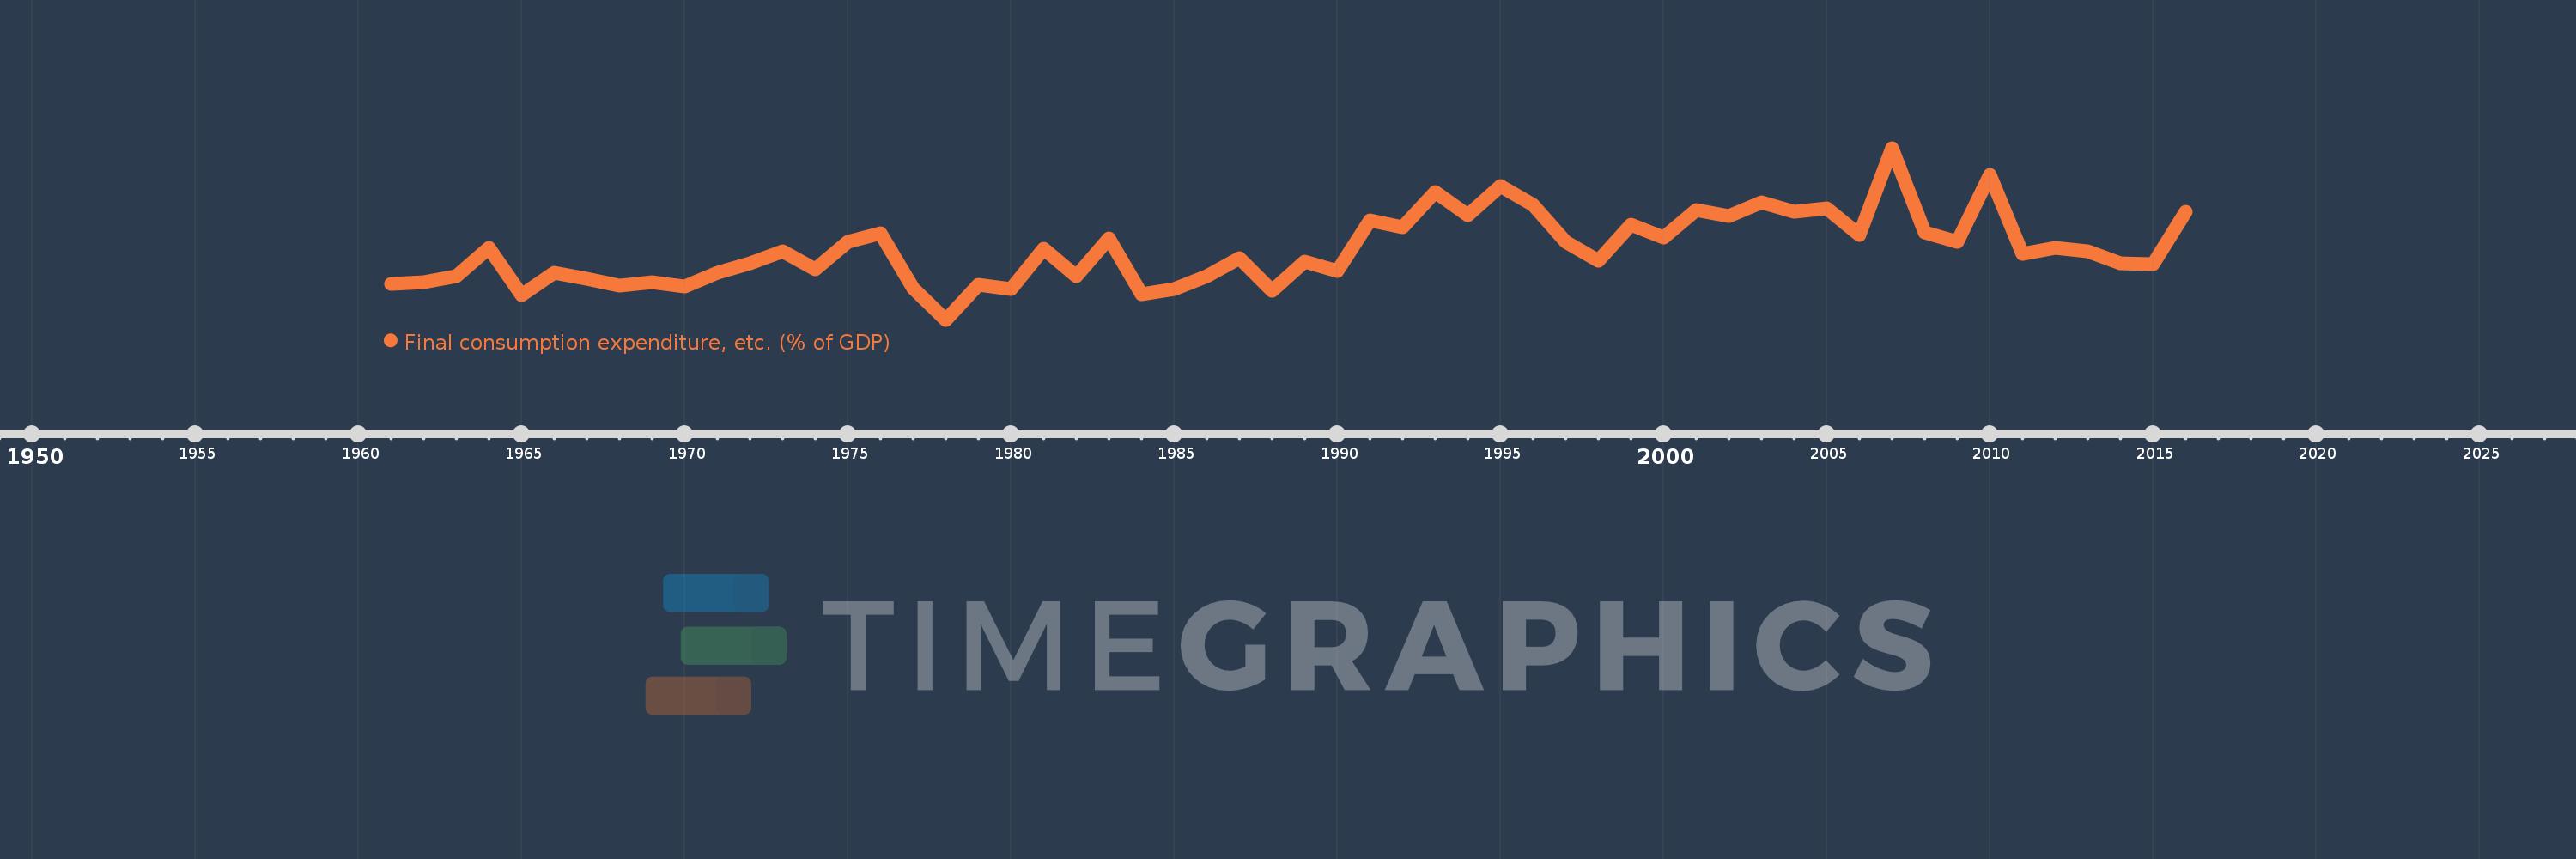
Final consumption expenditure, etc. (% of GDP)
2016,2015,2014,2013,2012,2011,2010,2009,2008,2007,2006,2005,2004,2003,2002,2001,2000,1999,1998,1997,1996,1995,1994,1993,1992,1991,1990,1989,1988,1987,1986,1985,1984,1983,1982,1981,1980,1979,1978,1977,1976,1975,1974,1973,1972,1971,1970,1969,1968,1967,1966,1965,1964,1963,1962,1961
This statistics in other country:
AfghanistanAlbaniaAlgeriaAngolaAntigua and BarbudaArgentinaArmeniaArubaAustraliaAustriaAzerbaijanBahamas, TheBahrainBangladeshBarbadosBelarusBelgiumBelizeBeninBermudaBhutanBoliviaBosnia and HerzegovinaBotswanaBrazilBrunei DarussalamBulgariaBurkina FasoBurundiCabo VerdeCambodiaCameroonCanadaCentral African RepublicChadChileChinaColombiaComorosCongo, Dem. Rep.Congo, Rep.Costa RicaCote d'IvoireCroatiaCubaCyprusCzech RepublicDenmarkDjiboutiDominicaDominican RepublicEcuadorEgypt, Arab Rep.El SalvadorEquatorial GuineaEritreaEstoniaEthiopiaFaroe IslandsFijiFinlandFranceGabonGambia, TheGeorgiaGermanyGhanaGreeceGrenadaGuatemalaGuineaGuinea-BissauGuyanaHaitiHondurasHong Kong SAR, ChinaHungaryIcelandIndiaIndonesiaIran, Islamic Rep.IraqIrelandIsraelItalyJamaicaJapanJordanKazakhstanKenyaKiribatiKorea, Rep.KosovoKuwaitKyrgyz RepublicLao PDRLatviaLebanonLesothoLiberiaLibyaLithuaniaLuxembourgMacao SAR, ChinaMacedonia, FYRMadagascarMalawiMalaysiaMaldivesMaliMaltaMauritaniaMauritiusMexicoMicronesia, Fed. Sts.MoldovaMongoliaMontenegroMoroccoMozambiqueNamibiaNepalNetherlandsNew CaledoniaNew ZealandNicaraguaNigerNigeriaNorwayOmanPakistanPanamaPapua New GuineaParaguayPeruPhilippinesPolandPortugalPuerto RicoQatarRomaniaRussian FederationRwandaSaudi ArabiaSenegalSerbiaSeychellesSierra LeoneSingaporeSlovak RepublicSloveniaSolomon IslandsSomaliaSouth AfricaSouth SudanSpainSri LankaSt. Kitts and NevisSt. LuciaSt. Vincent and the GrenadinesSudanSurinameSwazilandSwedenSwitzerlandSyrian Arab RepublicTajikistanTanzaniaThailandTimor-LesteTogoTongaTrinidad and TobagoTunisiaTurkeyTurkmenistanUgandaUkraineUnited Arab EmiratesUnited KingdomUnited StatesUruguayUzbekistanVanuatuVenezuela, RBVietnamWest Bank and GazaYemen, Rep.ZambiaZimbabwe Timeline:
This timeline shows a graph from 1961 to 2016 of Burundi. No data until 1960. Number of actual observations by date: 56.
Source name:
World Development Indicators
Source organization:
World Bank national accounts data, and OECD National Accounts data files.
Categories, topics:
Economy & Growth
Last updated:
apr 23, 2017
Indicators value changes by year
Minimum:
88.499
jan 1, 1978
Maximum:
117.632
jan 1, 2007
At the date of observation
Value
Absolute change
Change from previous value
jan 1, 1961
94.643
+94.643
0.0%
jan 1, 1962
94.828
+0.185
0.2%
jan 1, 1963
95.902
+1.074
1.13%
jan 1, 1964
100.752
+4.85
5.06%
jan 1, 1965
92.617
-8.134
-8.07%
jan 1, 1966
96.42
+3.802
4.11%
jan 1, 1967
95.448
-0.971
-1.01%
jan 1, 1968
94.234
-1.215
-1.27%
jan 1, 1969
94.881
+0.648
0.69%
jan 1, 1970
94.147
-0.734
-0.77%
jan 1, 1971
96.401
+2.254
2.39%
jan 1, 1972
98.128
+1.727
1.79%
jan 1, 1973
100.159
+2.031
2.07%
jan 1, 1974
97.005
-3.154
-3.15%
jan 1, 1975
101.728
+4.724
4.87%
jan 1, 1976
103.146
+1.418
1.39%
jan 1, 1977
93.838
-9.308
-9.02%
jan 1, 1978
88.499
-5.339
-5.69%
jan 1, 1979
94.482
+5.982
6.76%
jan 1, 1980
93.643
-0.839
-0.89%
jan 1, 1981
100.597
+6.954
7.43%
jan 1, 1982
95.888
-4.709
-4.68%
jan 1, 1983
102.238
+6.35
6.62%
jan 1, 1984
92.875
-9.363
-9.16%
jan 1, 1985
93.677
+0.802
0.86%
jan 1, 1986
95.899
+2.222
2.37%
jan 1, 1987
98.948
+3.049
3.18%
jan 1, 1988
93.381
-5.567
-5.63%
jan 1, 1989
98.327
+4.946
5.3%
jan 1, 1990
96.735
-1.592
-1.62%
jan 1, 1991
105.365
+8.63
8.92%
jan 1, 1992
104.178
-1.187
-1.13%
jan 1, 1993
110.089
+5.911
5.67%
jan 1, 1994
106.239
-3.851
-3.5%
jan 1, 1995
111.236
+4.997
4.7%
jan 1, 1996
107.989
-3.247
-2.92%
jan 1, 1997
101.723
-6.265
-5.8%
jan 1, 1998
98.508
-3.216
-3.16%
jan 1, 1999
104.669
+6.161
6.25%
jan 1, 2000
102.503
-2.166
-2.07%
jan 1, 2001
107.135
+4.631
4.52%
jan 1, 2002
106.137
-0.997
-0.93%
jan 1, 2003
108.354
+2.216
2.09%
jan 1, 2004
106.745
-1.609
-1.48%
jan 1, 2005
107.324
+0.579
0.54%
jan 1, 2006
102.869
-4.454
-4.15%
jan 1, 2007
117.632
+14.763
14.35%
jan 1, 2008
103.359
-14.274
-12.13%
jan 1, 2009
101.77
-1.588
-1.54%
jan 1, 2010
113.073
+11.303
11.11%
jan 1, 2011
99.743
-13.331
-11.79%
jan 1, 2012
100.723
+0.98
0.98%
jan 1, 2013
100.146
-0.577
-0.57%
jan 1, 2014
98.104
-2.041
-2.04%
jan 1, 2015
97.958
-0.146
-0.15%
jan 1, 2016
106.785
+8.827
9.01%
Ranking of countries by current statistics by years


Comments: