29
/
en
AIzaSyAYiBZKx7MnpbEhh9jyipgxe19OcubqV5w
April 1, 2024
124758
Egypt, Arab Rep.
EGY
true
2
1
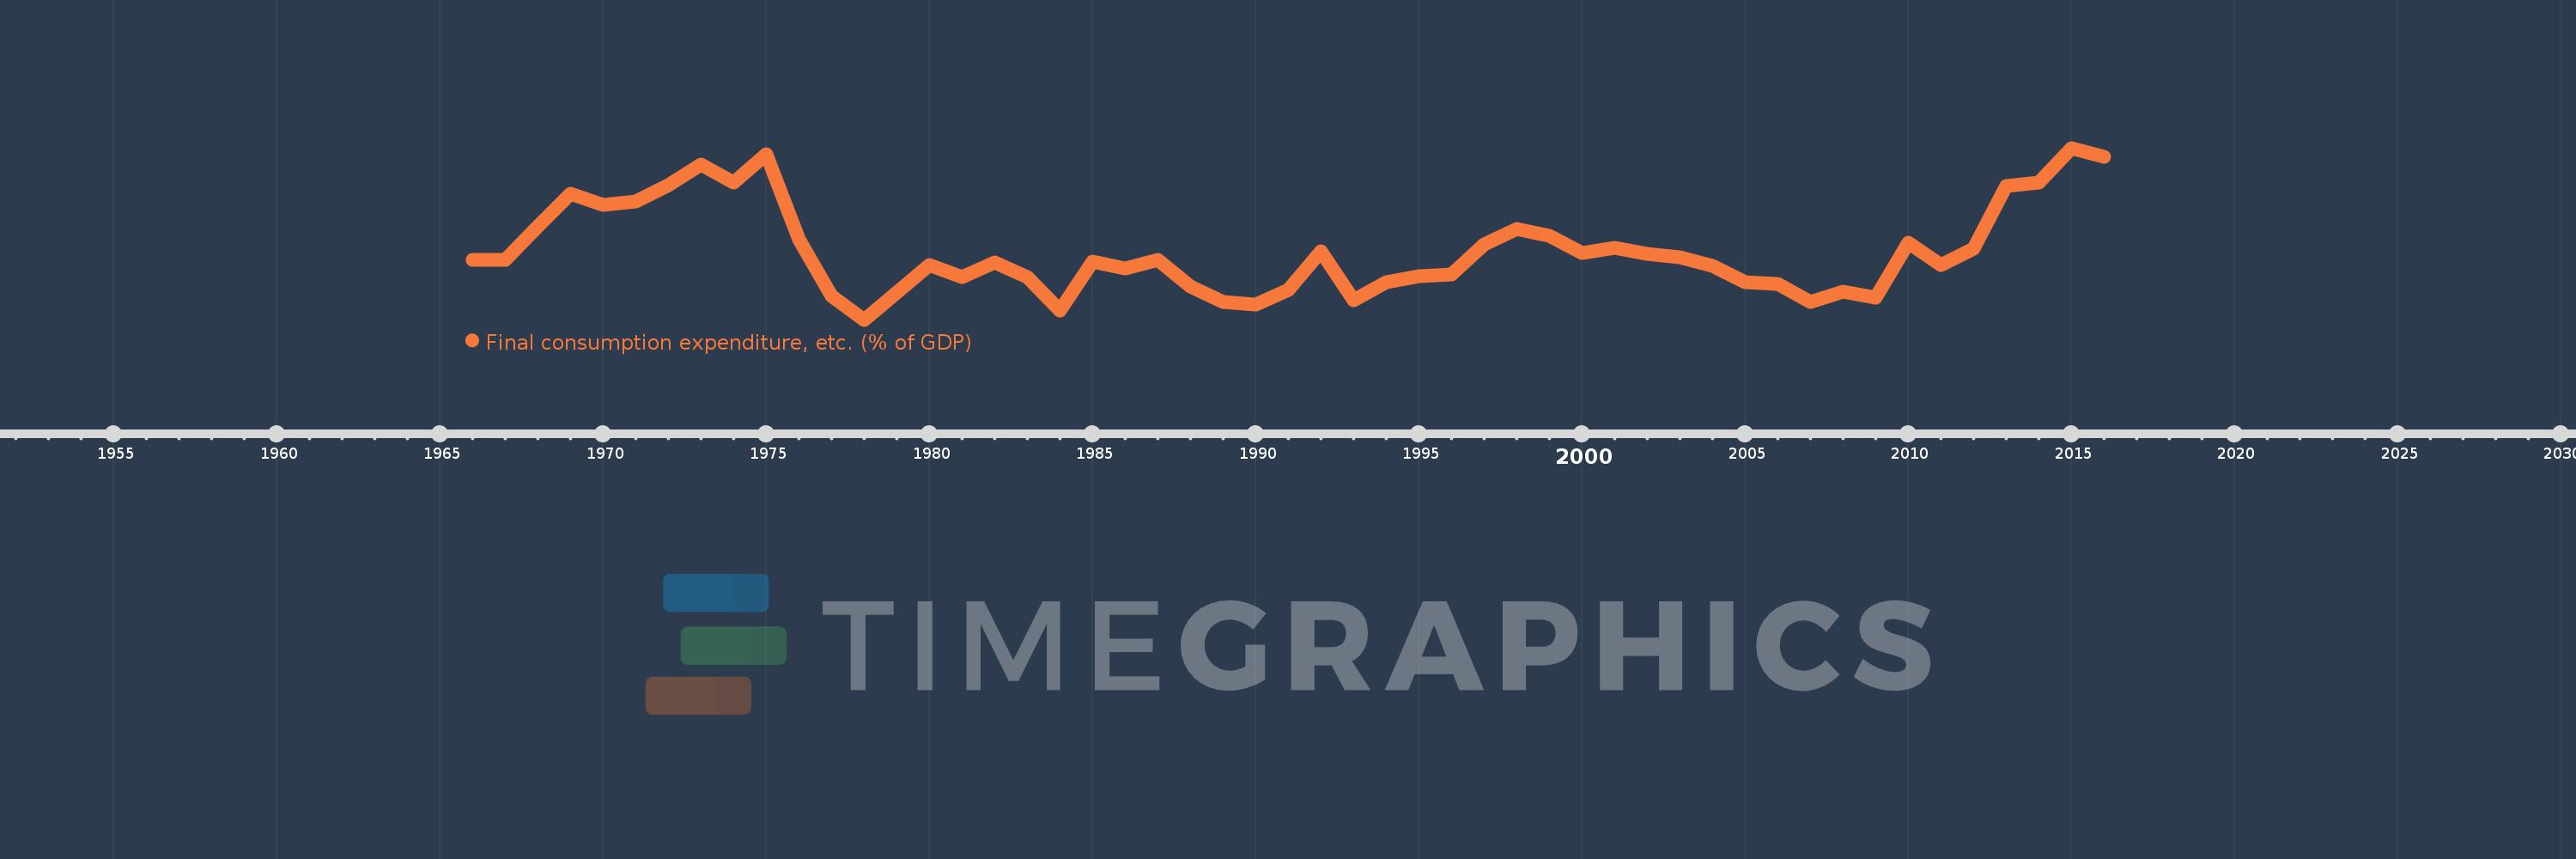
Final consumption expenditure, etc. (% of GDP)
2016,2015,2014,2013,2012,2011,2010,2009,2008,2007,2006,2005,2004,2003,2002,2001,2000,1999,1998,1997,1996,1995,1994,1993,1992,1991,1990,1989,1988,1987,1986,1985,1984,1983,1982,1981,1980,1979,1978,1977,1976,1975,1974,1973,1972,1971,1970,1969,1968,1967,1966
This statistics in other country:
AfghanistanAlbaniaAlgeriaAngolaAntigua and BarbudaArgentinaArmeniaArubaAustraliaAustriaAzerbaijanBahamas, TheBahrainBangladeshBarbadosBelarusBelgiumBelizeBeninBermudaBhutanBoliviaBosnia and HerzegovinaBotswanaBrazilBrunei DarussalamBulgariaBurkina FasoBurundiCabo VerdeCambodiaCameroonCanadaCentral African RepublicChadChileChinaColombiaComorosCongo, Dem. Rep.Congo, Rep.Costa RicaCote d'IvoireCroatiaCubaCyprusCzech RepublicDenmarkDjiboutiDominicaDominican RepublicEcuadorEgypt, Arab Rep.El SalvadorEquatorial GuineaEritreaEstoniaEthiopiaFaroe IslandsFijiFinlandFranceGabonGambia, TheGeorgiaGermanyGhanaGreeceGrenadaGuatemalaGuineaGuinea-BissauGuyanaHaitiHondurasHong Kong SAR, ChinaHungaryIcelandIndiaIndonesiaIran, Islamic Rep.IraqIrelandIsraelItalyJamaicaJapanJordanKazakhstanKenyaKiribatiKorea, Rep.KosovoKuwaitKyrgyz RepublicLao PDRLatviaLebanonLesothoLiberiaLibyaLithuaniaLuxembourgMacao SAR, ChinaMacedonia, FYRMadagascarMalawiMalaysiaMaldivesMaliMaltaMauritaniaMauritiusMexicoMicronesia, Fed. Sts.MoldovaMongoliaMontenegroMoroccoMozambiqueNamibiaNepalNetherlandsNew CaledoniaNew ZealandNicaraguaNigerNigeriaNorwayOmanPakistanPanamaPapua New GuineaParaguayPeruPhilippinesPolandPortugalPuerto RicoQatarRomaniaRussian FederationRwandaSaudi ArabiaSenegalSerbiaSeychellesSierra LeoneSingaporeSlovak RepublicSloveniaSolomon IslandsSomaliaSouth AfricaSouth SudanSpainSri LankaSt. Kitts and NevisSt. LuciaSt. Vincent and the GrenadinesSudanSurinameSwazilandSwedenSwitzerlandSyrian Arab RepublicTajikistanTanzaniaThailandTimor-LesteTogoTongaTrinidad and TobagoTunisiaTurkeyTurkmenistanUgandaUkraineUnited Arab EmiratesUnited KingdomUnited StatesUruguayUzbekistanVanuatuVenezuela, RBVietnamWest Bank and GazaYemen, Rep.ZambiaZimbabwe Timeline:
This timeline shows a graph from 1966 to 2016 of Egypt, Arab Rep.. No data until 1965. Number of actual observations by date: 51.
Source name:
World Development Indicators
Source organization:
World Bank national accounts data, and OECD National Accounts data files.
Categories, topics:
Economy & Growth
Last updated:
apr 23, 2017
Indicators value changes by year
Minimum:
81.544
jan 1, 1978
Maximum:
94.719
jan 1, 2015
At the date of observation
Value
Absolute change
Change from previous value
jan 1, 1966
86.116
+86.116
0.0%
jan 1, 1967
86.135
+0.019
0.02%
jan 1, 1968
88.692
+2.557
2.97%
jan 1, 1969
91.181
+2.489
2.81%
jan 1, 1970
90.345
-0.835
-0.92%
jan 1, 1971
90.619
+0.274
0.3%
jan 1, 1972
91.873
+1.254
1.38%
jan 1, 1973
93.445
+1.572
1.71%
jan 1, 1974
92.032
-1.414
-1.51%
jan 1, 1975
94.261
+2.23
2.42%
jan 1, 1976
87.735
-6.527
-6.92%
jan 1, 1977
83.336
-4.399
-5.01%
jan 1, 1978
81.544
-1.792
-2.15%
jan 1, 1979
83.614
+2.07
2.54%
jan 1, 1980
85.762
+2.147
2.57%
jan 1, 1981
84.837
-0.924
-1.08%
jan 1, 1982
85.924
+1.087
1.28%
jan 1, 1983
84.823
-1.101
-1.28%
jan 1, 1984
82.218
-2.605
-3.07%
jan 1, 1985
85.977
+3.76
4.57%
jan 1, 1986
85.452
-0.525
-0.61%
jan 1, 1987
86.156
+0.704
0.82%
jan 1, 1988
84.125
-2.031
-2.36%
jan 1, 1989
82.923
-1.201
-1.43%
jan 1, 1990
82.683
-0.24
-0.29%
jan 1, 1991
83.853
+1.169
1.41%
jan 1, 1992
86.81
+2.958
3.53%
jan 1, 1993
83.034
-3.777
-4.35%
jan 1, 1994
84.407
+1.373
1.65%
jan 1, 1995
84.857
+0.45
0.53%
jan 1, 1996
85.0
+0.143
0.17%
jan 1, 1997
87.315
+2.315
2.72%
jan 1, 1998
88.492
+1.177
1.35%
jan 1, 1999
87.996
-0.496
-0.56%
jan 1, 2000
86.638
-1.357
-1.54%
jan 1, 2001
87.063
+0.424
0.49%
jan 1, 2002
86.59
-0.472
-0.54%
jan 1, 2003
86.355
-0.235
-0.27%
jan 1, 2004
85.701
-0.655
-0.76%
jan 1, 2005
84.422
-1.279
-1.49%
jan 1, 2006
84.29
-0.132
-0.16%
jan 1, 2007
82.888
-1.402
-1.66%
jan 1, 2008
83.727
+0.839
1.01%
jan 1, 2009
83.205
-0.522
-0.62%
jan 1, 2010
87.45
+4.245
5.1%
jan 1, 2011
85.737
-1.713
-1.96%
jan 1, 2012
87.018
+1.281
1.49%
jan 1, 2013
91.802
+4.785
5.5%
jan 1, 2014
92.054
+0.252
0.27%
jan 1, 2015
94.719
+2.665
2.89%
jan 1, 2016
94.068
-0.651
-0.69%
Ranking of countries by current statistics by years


Comments: