29
/
en
AIzaSyAYiBZKx7MnpbEhh9jyipgxe19OcubqV5w
April 1, 2024
94823
Burkina Faso
BFA
true
2
1
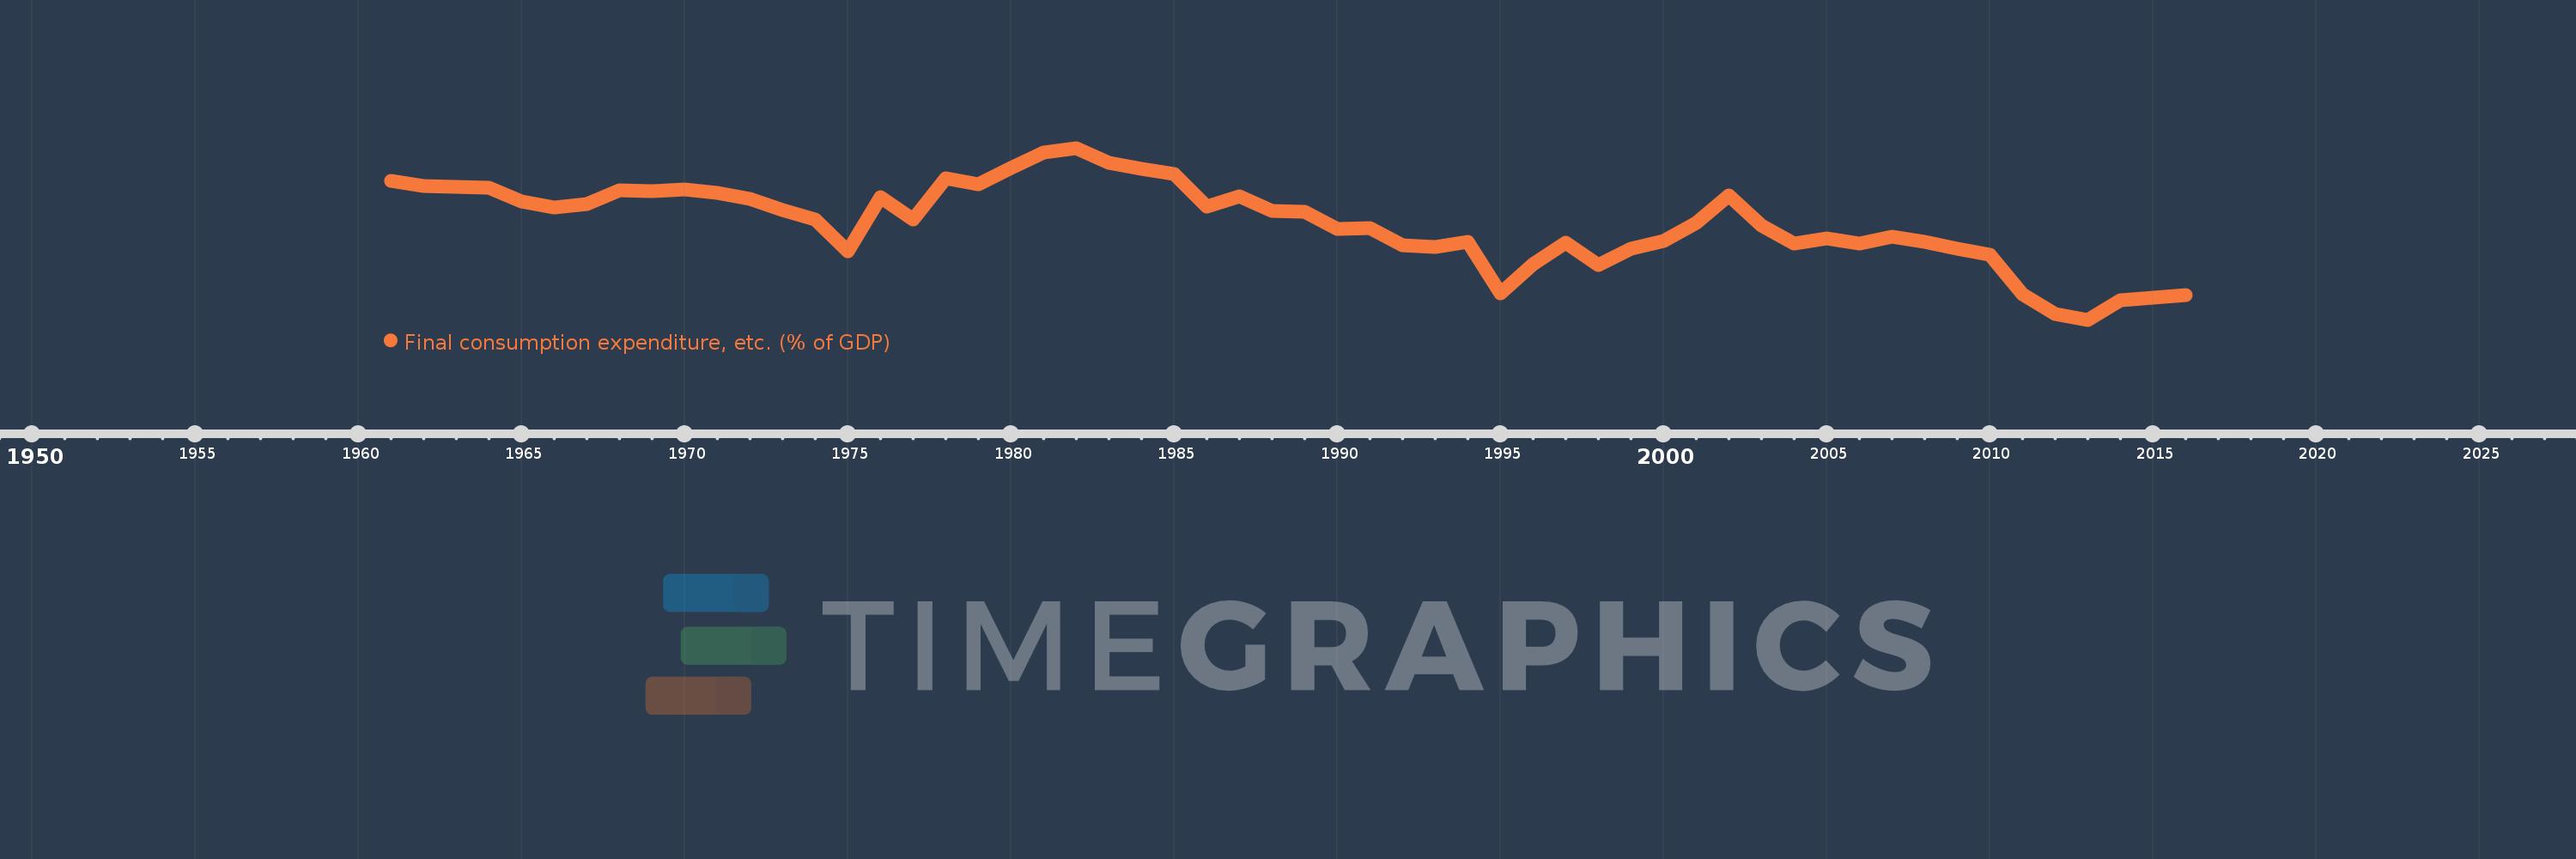
Final consumption expenditure, etc. (% of GDP)
2016,2015,2014,2013,2012,2011,2010,2009,2008,2007,2006,2005,2004,2003,2002,2001,2000,1999,1998,1997,1996,1995,1994,1993,1992,1991,1990,1989,1988,1987,1986,1985,1984,1983,1982,1981,1980,1979,1978,1977,1976,1975,1974,1973,1972,1971,1970,1969,1968,1967,1966,1965,1964,1963,1962,1961
This statistics in other country:
AfghanistanAlbaniaAlgeriaAngolaAntigua and BarbudaArgentinaArmeniaArubaAustraliaAustriaAzerbaijanBahamas, TheBahrainBangladeshBarbadosBelarusBelgiumBelizeBeninBermudaBhutanBoliviaBosnia and HerzegovinaBotswanaBrazilBrunei DarussalamBulgariaBurkina FasoBurundiCabo VerdeCambodiaCameroonCanadaCentral African RepublicChadChileChinaColombiaComorosCongo, Dem. Rep.Congo, Rep.Costa RicaCote d'IvoireCroatiaCubaCyprusCzech RepublicDenmarkDjiboutiDominicaDominican RepublicEcuadorEgypt, Arab Rep.El SalvadorEquatorial GuineaEritreaEstoniaEthiopiaFaroe IslandsFijiFinlandFranceGabonGambia, TheGeorgiaGermanyGhanaGreeceGrenadaGuatemalaGuineaGuinea-BissauGuyanaHaitiHondurasHong Kong SAR, ChinaHungaryIcelandIndiaIndonesiaIran, Islamic Rep.IraqIrelandIsraelItalyJamaicaJapanJordanKazakhstanKenyaKiribatiKorea, Rep.KosovoKuwaitKyrgyz RepublicLao PDRLatviaLebanonLesothoLiberiaLibyaLithuaniaLuxembourgMacao SAR, ChinaMacedonia, FYRMadagascarMalawiMalaysiaMaldivesMaliMaltaMauritaniaMauritiusMexicoMicronesia, Fed. Sts.MoldovaMongoliaMontenegroMoroccoMozambiqueNamibiaNepalNetherlandsNew CaledoniaNew ZealandNicaraguaNigerNigeriaNorwayOmanPakistanPanamaPapua New GuineaParaguayPeruPhilippinesPolandPortugalPuerto RicoQatarRomaniaRussian FederationRwandaSaudi ArabiaSenegalSerbiaSeychellesSierra LeoneSingaporeSlovak RepublicSloveniaSolomon IslandsSomaliaSouth AfricaSouth SudanSpainSri LankaSt. Kitts and NevisSt. LuciaSt. Vincent and the GrenadinesSudanSurinameSwazilandSwedenSwitzerlandSyrian Arab RepublicTajikistanTanzaniaThailandTimor-LesteTogoTongaTrinidad and TobagoTunisiaTurkeyTurkmenistanUgandaUkraineUnited Arab EmiratesUnited KingdomUnited StatesUruguayUzbekistanVanuatuVenezuela, RBVietnamWest Bank and GazaYemen, Rep.ZambiaZimbabwe Timeline:
This timeline shows a graph from 1961 to 2016 of Burkina Faso. No data until 1960. Number of actual observations by date: 56.
Source name:
World Development Indicators
Source organization:
World Bank national accounts data, and OECD National Accounts data files.
Categories, topics:
Economy & Growth
Last updated:
apr 23, 2017
Indicators value changes by year
Maximum:
108.028
jan 1, 1982
At the date of observation
Value
Absolute change
Change from previous value
jan 1, 1961
102.458
+102.458
0.0%
jan 1, 1962
101.707
-0.751
-0.73%
jan 1, 1963
101.466
-0.241
-0.24%
jan 1, 1964
101.288
-0.178
-0.18%
jan 1, 1965
99.08
-2.208
-2.18%
jan 1, 1966
98.012
-1.068
-1.08%
jan 1, 1967
98.625
+0.613
0.63%
jan 1, 1968
100.976
+2.351
2.38%
jan 1, 1969
100.812
-0.164
-0.16%
jan 1, 1970
101.105
+0.292
0.29%
jan 1, 1971
100.416
-0.688
-0.68%
jan 1, 1972
99.546
-0.871
-0.87%
jan 1, 1973
97.612
-1.934
-1.94%
jan 1, 1974
95.977
-1.635
-1.68%
jan 1, 1975
90.629
-5.348
-5.57%
jan 1, 1976
99.699
+9.07
10.01%
jan 1, 1977
95.958
-3.74
-3.75%
jan 1, 1978
102.921
+6.962
7.26%
jan 1, 1979
101.963
-0.957
-0.93%
jan 1, 1980
104.636
+2.673
2.62%
jan 1, 1981
107.205
+2.569
2.46%
jan 1, 1982
108.028
+0.823
0.77%
jan 1, 1983
105.502
-2.526
-2.34%
jan 1, 1984
104.558
-0.944
-0.89%
jan 1, 1985
103.63
-0.927
-0.89%
jan 1, 1986
98.151
-5.479
-5.29%
jan 1, 1987
99.844
+1.693
1.72%
jan 1, 1988
97.5
-2.344
-2.35%
jan 1, 1989
97.343
-0.156
-0.16%
jan 1, 1990
94.487
-2.856
-2.93%
jan 1, 1991
94.576
+0.089
0.09%
jan 1, 1992
91.656
-2.92
-3.09%
jan 1, 1993
91.379
-0.277
-0.3%
jan 1, 1994
92.263
+0.884
0.97%
jan 1, 1995
83.66
-8.603
-9.32%
jan 1, 1996
88.541
+4.881
5.83%
jan 1, 1997
92.108
+3.567
4.03%
jan 1, 1998
88.4
-3.709
-4.03%
jan 1, 1999
91.149
+2.749
3.11%
jan 1, 2000
92.443
+1.294
1.42%
jan 1, 2001
95.379
+2.936
3.18%
jan 1, 2002
100.094
+4.715
4.94%
jan 1, 2003
94.984
-5.11
-5.11%
jan 1, 2004
92.006
-2.978
-3.13%
jan 1, 2005
92.809
+0.803
0.87%
jan 1, 2006
91.952
-0.857
-0.92%
jan 1, 2007
93.135
+1.183
1.29%
jan 1, 2008
92.289
-0.846
-0.91%
jan 1, 2009
91.17
-1.12
-1.21%
jan 1, 2010
90.151
-1.019
-1.12%
jan 1, 2011
83.482
-6.668
-7.4%
jan 1, 2012
80.18
-3.303
-3.96%
jan 1, 2013
79.19
-0.99
-1.23%
jan 1, 2014
82.522
+3.333
4.21%
jan 1, 2015
82.952
+0.429
0.52%
jan 1, 2016
83.29
+0.338
0.41%
Ranking of countries by current statistics by years


Comments: