29
/
en
AIzaSyAYiBZKx7MnpbEhh9jyipgxe19OcubqV5w
April 1, 2024
153505
Iceland
ISL
true
2
1
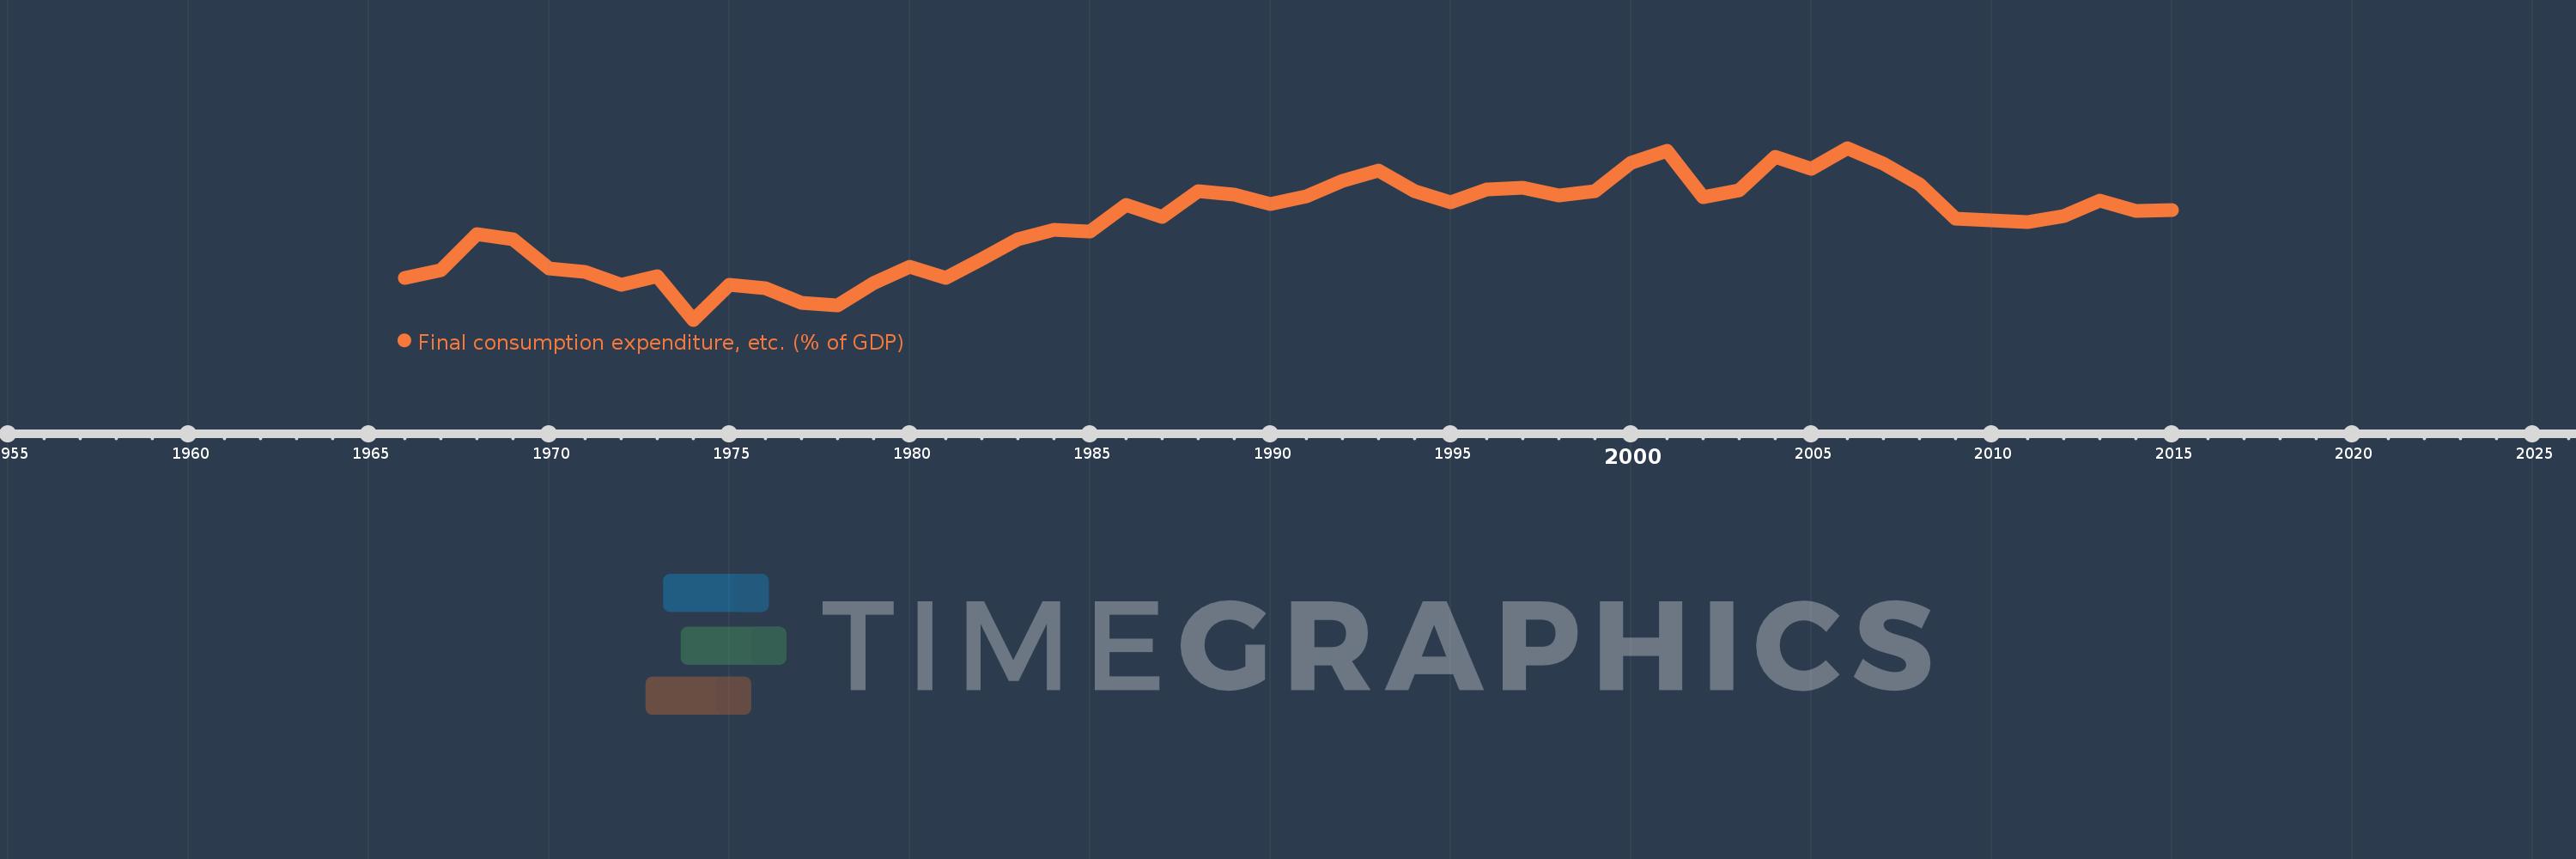
Final consumption expenditure, etc. (% of GDP)
2015,2014,2013,2012,2011,2010,2009,2008,2007,2006,2005,2004,2003,2002,2001,2000,1999,1998,1997,1996,1995,1994,1993,1992,1991,1990,1989,1988,1987,1986,1985,1984,1983,1982,1981,1980,1979,1978,1977,1976,1975,1974,1973,1972,1971,1970,1969,1968,1967,1966
This statistics in other country:
AfghanistanAlbaniaAlgeriaAngolaAntigua and BarbudaArgentinaArmeniaArubaAustraliaAustriaAzerbaijanBahamas, TheBahrainBangladeshBarbadosBelarusBelgiumBelizeBeninBermudaBhutanBoliviaBosnia and HerzegovinaBotswanaBrazilBrunei DarussalamBulgariaBurkina FasoBurundiCabo VerdeCambodiaCameroonCanadaCentral African RepublicChadChileChinaColombiaComorosCongo, Dem. Rep.Congo, Rep.Costa RicaCote d'IvoireCroatiaCubaCyprusCzech RepublicDenmarkDjiboutiDominicaDominican RepublicEcuadorEgypt, Arab Rep.El SalvadorEquatorial GuineaEritreaEstoniaEthiopiaFaroe IslandsFijiFinlandFranceGabonGambia, TheGeorgiaGermanyGhanaGreeceGrenadaGuatemalaGuineaGuinea-BissauGuyanaHaitiHondurasHong Kong SAR, ChinaHungaryIcelandIndiaIndonesiaIran, Islamic Rep.IraqIrelandIsraelItalyJamaicaJapanJordanKazakhstanKenyaKiribatiKorea, Rep.KosovoKuwaitKyrgyz RepublicLao PDRLatviaLebanonLesothoLiberiaLibyaLithuaniaLuxembourgMacao SAR, ChinaMacedonia, FYRMadagascarMalawiMalaysiaMaldivesMaliMaltaMauritaniaMauritiusMexicoMicronesia, Fed. Sts.MoldovaMongoliaMontenegroMoroccoMozambiqueNamibiaNepalNetherlandsNew CaledoniaNew ZealandNicaraguaNigerNigeriaNorwayOmanPakistanPanamaPapua New GuineaParaguayPeruPhilippinesPolandPortugalPuerto RicoQatarRomaniaRussian FederationRwandaSaudi ArabiaSenegalSerbiaSeychellesSierra LeoneSingaporeSlovak RepublicSloveniaSolomon IslandsSomaliaSouth AfricaSouth SudanSpainSri LankaSt. Kitts and NevisSt. LuciaSt. Vincent and the GrenadinesSudanSurinameSwazilandSwedenSwitzerlandSyrian Arab RepublicTajikistanTanzaniaThailandTimor-LesteTogoTongaTrinidad and TobagoTunisiaTurkeyTurkmenistanUgandaUkraineUnited Arab EmiratesUnited KingdomUnited StatesUruguayUzbekistanVanuatuVenezuela, RBVietnamWest Bank and GazaYemen, Rep.ZambiaZimbabwe Timeline:
This timeline shows a graph from 1966 to 2015 of Iceland. No data until 1965. Number of actual observations by date: 50.
Source name:
World Development Indicators
Source organization:
World Bank national accounts data, and OECD National Accounts data files.
Categories, topics:
Economy & Growth
Last updated:
apr 23, 2017
Indicators value changes by year
Minimum:
67.052
jan 1, 1974
Maximum:
82.603
jan 1, 2006
At the date of observation
Value
Absolute change
Change from previous value
jan 1, 1966
70.853
+70.853
0.0%
jan 1, 1967
71.528
+0.675
0.95%
jan 1, 1968
74.791
+3.263
4.56%
jan 1, 1969
74.308
-0.483
-0.65%
jan 1, 1970
71.702
-2.606
-3.51%
jan 1, 1971
71.377
-0.325
-0.45%
jan 1, 1972
70.238
-1.139
-1.6%
jan 1, 1973
71.023
+0.785
1.12%
jan 1, 1974
67.052
-3.971
-5.59%
jan 1, 1975
70.253
+3.201
4.77%
jan 1, 1976
69.876
-0.377
-0.54%
jan 1, 1977
68.572
-1.304
-1.87%
jan 1, 1978
68.346
-0.226
-0.33%
jan 1, 1979
70.343
+1.997
2.92%
jan 1, 1980
71.819
+1.476
2.1%
jan 1, 1981
70.801
-1.018
-1.42%
jan 1, 1982
72.527
+1.726
2.44%
jan 1, 1983
74.351
+1.824
2.52%
jan 1, 1984
75.216
+0.864
1.16%
jan 1, 1985
75.047
-0.169
-0.22%
jan 1, 1986
77.436
+2.389
3.18%
jan 1, 1987
76.358
-1.077
-1.39%
jan 1, 1988
78.687
+2.328
3.05%
jan 1, 1989
78.399
-0.287
-0.37%
jan 1, 1990
77.518
-0.882
-1.12%
jan 1, 1991
78.259
+0.742
0.96%
jan 1, 1992
79.605
+1.346
1.72%
jan 1, 1993
80.556
+0.951
1.19%
jan 1, 1994
78.677
-1.88
-2.33%
jan 1, 1995
77.714
-0.963
-1.22%
jan 1, 1996
78.858
+1.144
1.47%
jan 1, 1997
78.983
+0.125
0.16%
jan 1, 1998
78.265
-0.718
-0.91%
jan 1, 1999
78.707
+0.442
0.56%
jan 1, 2000
81.227
+2.52
3.2%
jan 1, 2001
82.359
+1.132
1.39%
jan 1, 2002
78.112
-4.246
-5.16%
jan 1, 2003
78.739
+0.627
0.8%
jan 1, 2004
81.802
+3.063
3.89%
jan 1, 2005
80.739
-1.063
-1.3%
jan 1, 2006
82.603
+1.865
2.31%
jan 1, 2007
81.152
-1.452
-1.76%
jan 1, 2008
79.339
-1.813
-2.23%
jan 1, 2009
76.192
-3.146
-3.97%
jan 1, 2010
76.081
-0.112
-0.15%
jan 1, 2011
75.913
-0.168
-0.22%
jan 1, 2012
76.456
+0.542
0.71%
jan 1, 2013
77.85
+1.394
1.82%
jan 1, 2014
76.925
-0.925
-1.19%
jan 1, 2015
76.949
+0.023
0.03%
Ranking of countries by current statistics by years


Comments: