29
/
en
AIzaSyAYiBZKx7MnpbEhh9jyipgxe19OcubqV5w
April 1, 2024
182044
Luxembourg
LUX
true
2
1
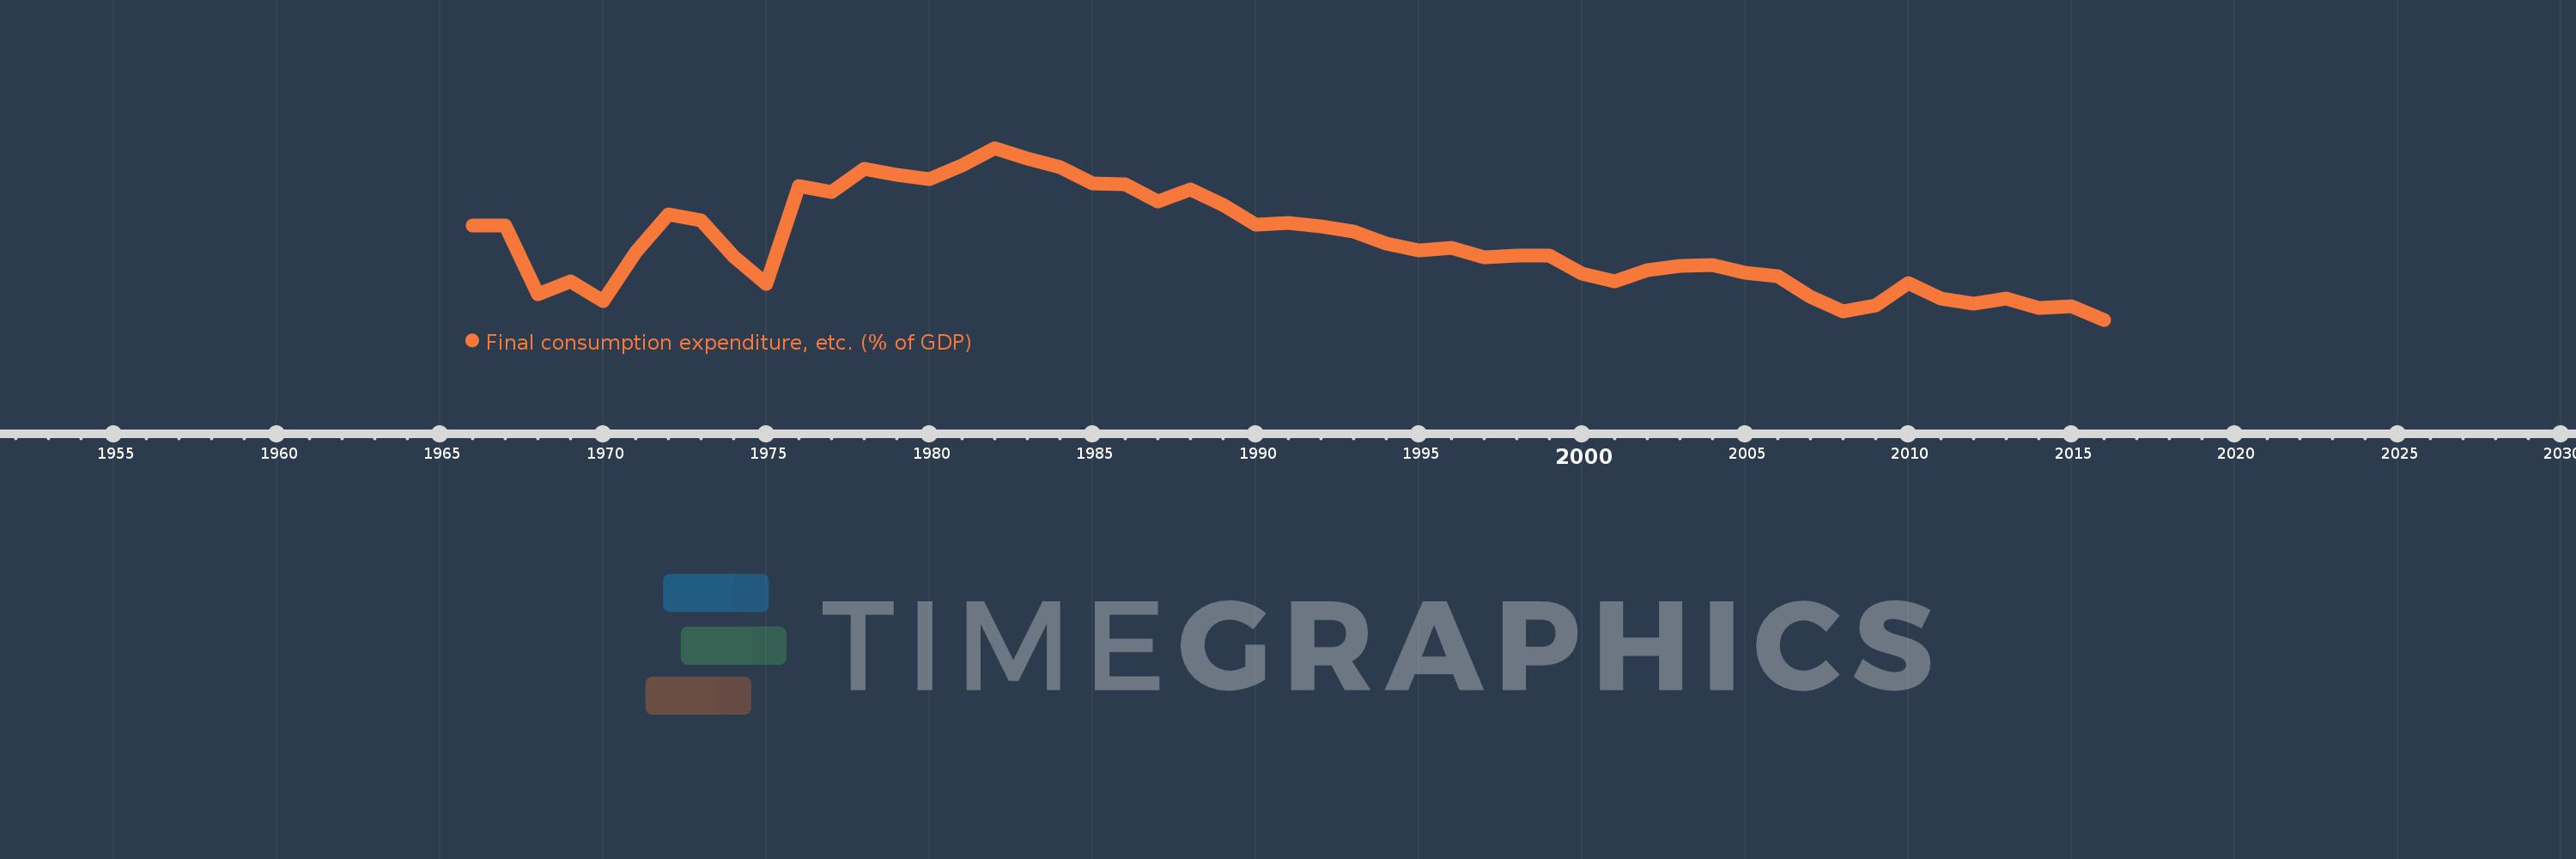
Final consumption expenditure, etc. (% of GDP)
2016,2015,2014,2013,2012,2011,2010,2009,2008,2007,2006,2005,2004,2003,2002,2001,2000,1999,1998,1997,1996,1995,1994,1993,1992,1991,1990,1989,1988,1987,1986,1985,1984,1983,1982,1981,1980,1979,1978,1977,1976,1975,1974,1973,1972,1971,1970,1969,1968,1967,1966
This statistics in other country:
AfghanistanAlbaniaAlgeriaAngolaAntigua and BarbudaArgentinaArmeniaArubaAustraliaAustriaAzerbaijanBahamas, TheBahrainBangladeshBarbadosBelarusBelgiumBelizeBeninBermudaBhutanBoliviaBosnia and HerzegovinaBotswanaBrazilBrunei DarussalamBulgariaBurkina FasoBurundiCabo VerdeCambodiaCameroonCanadaCentral African RepublicChadChileChinaColombiaComorosCongo, Dem. Rep.Congo, Rep.Costa RicaCote d'IvoireCroatiaCubaCyprusCzech RepublicDenmarkDjiboutiDominicaDominican RepublicEcuadorEgypt, Arab Rep.El SalvadorEquatorial GuineaEritreaEstoniaEthiopiaFaroe IslandsFijiFinlandFranceGabonGambia, TheGeorgiaGermanyGhanaGreeceGrenadaGuatemalaGuineaGuinea-BissauGuyanaHaitiHondurasHong Kong SAR, ChinaHungaryIcelandIndiaIndonesiaIran, Islamic Rep.IraqIrelandIsraelItalyJamaicaJapanJordanKazakhstanKenyaKiribatiKorea, Rep.KosovoKuwaitKyrgyz RepublicLao PDRLatviaLebanonLesothoLiberiaLibyaLithuaniaLuxembourgMacao SAR, ChinaMacedonia, FYRMadagascarMalawiMalaysiaMaldivesMaliMaltaMauritaniaMauritiusMexicoMicronesia, Fed. Sts.MoldovaMongoliaMontenegroMoroccoMozambiqueNamibiaNepalNetherlandsNew CaledoniaNew ZealandNicaraguaNigerNigeriaNorwayOmanPakistanPanamaPapua New GuineaParaguayPeruPhilippinesPolandPortugalPuerto RicoQatarRomaniaRussian FederationRwandaSaudi ArabiaSenegalSerbiaSeychellesSierra LeoneSingaporeSlovak RepublicSloveniaSolomon IslandsSomaliaSouth AfricaSouth SudanSpainSri LankaSt. Kitts and NevisSt. LuciaSt. Vincent and the GrenadinesSudanSurinameSwazilandSwedenSwitzerlandSyrian Arab RepublicTajikistanTanzaniaThailandTimor-LesteTogoTongaTrinidad and TobagoTunisiaTurkeyTurkmenistanUgandaUkraineUnited Arab EmiratesUnited KingdomUnited StatesUruguayUzbekistanVanuatuVenezuela, RBVietnamWest Bank and GazaYemen, Rep.ZambiaZimbabwe Timeline:
This timeline shows a graph from 1966 to 2016 of Luxembourg. No data until 1965. Number of actual observations by date: 51.
Source name:
World Development Indicators
Source organization:
World Bank national accounts data, and OECD National Accounts data files.
Categories, topics:
Economy & Growth
Last updated:
apr 23, 2017
Indicators value changes by year
Minimum:
46.045
jan 1, 2016
Maximum:
74.895
jan 1, 1982
At the date of observation
Value
Absolute change
Change from previous value
jan 1, 1966
61.805
+61.805
0.0%
jan 1, 1967
61.839
+0.034
0.06%
jan 1, 1968
50.337
-11.502
-18.6%
jan 1, 1969
52.546
+2.209
4.39%
jan 1, 1970
49.182
-3.364
-6.4%
jan 1, 1971
57.4
+8.219
16.71%
jan 1, 1972
63.691
+6.291
10.96%
jan 1, 1973
62.696
-0.995
-1.56%
jan 1, 1974
56.708
-5.988
-9.55%
jan 1, 1975
52.063
-4.645
-8.19%
jan 1, 1976
68.507
+16.444
31.58%
jan 1, 1977
67.454
-1.052
-1.54%
jan 1, 1978
71.339
+3.885
5.76%
jan 1, 1979
70.428
-0.911
-1.28%
jan 1, 1980
69.625
-0.803
-1.14%
jan 1, 1981
71.958
+2.333
3.35%
jan 1, 1982
74.895
+2.937
4.08%
jan 1, 1983
73.189
-1.706
-2.28%
jan 1, 1984
71.664
-1.524
-2.08%
jan 1, 1985
68.914
-2.75
-3.84%
jan 1, 1986
68.731
-0.183
-0.27%
jan 1, 1987
65.954
-2.777
-4.04%
jan 1, 1988
67.941
+1.987
3.01%
jan 1, 1989
65.392
-2.549
-3.75%
jan 1, 1990
61.949
-3.443
-5.27%
jan 1, 1991
62.332
+0.383
0.62%
jan 1, 1992
61.78
-0.552
-0.89%
jan 1, 1993
60.797
-0.982
-1.59%
jan 1, 1994
58.812
-1.985
-3.27%
jan 1, 1995
57.714
-1.098
-1.87%
jan 1, 1996
58.164
+0.45
0.78%
jan 1, 1997
56.576
-1.588
-2.73%
jan 1, 1998
56.886
+0.31
0.55%
jan 1, 1999
56.769
-0.117
-0.21%
jan 1, 2000
53.759
-3.01
-5.3%
jan 1, 2001
52.558
-1.201
-2.23%
jan 1, 2002
54.411
+1.853
3.53%
jan 1, 2003
55.118
+0.707
1.3%
jan 1, 2004
55.239
+0.121
0.22%
jan 1, 2005
53.997
-1.242
-2.25%
jan 1, 2006
53.302
-0.695
-1.29%
jan 1, 2007
49.854
-3.448
-6.47%
jan 1, 2008
47.499
-2.355
-4.72%
jan 1, 2009
48.426
+0.927
1.95%
jan 1, 2010
52.141
+3.715
7.67%
jan 1, 2011
49.616
-2.525
-4.84%
jan 1, 2012
48.728
-0.888
-1.79%
jan 1, 2013
49.649
+0.92
1.89%
jan 1, 2014
48.03
-1.619
-3.26%
jan 1, 2015
48.282
+0.252
0.53%
jan 1, 2016
46.045
-2.237
-4.63%
Ranking of countries by current statistics by years


Comments: