29
/
en
AIzaSyAYiBZKx7MnpbEhh9jyipgxe19OcubqV5w
April 1, 2024
214275
Norway
NOR
true
2
1
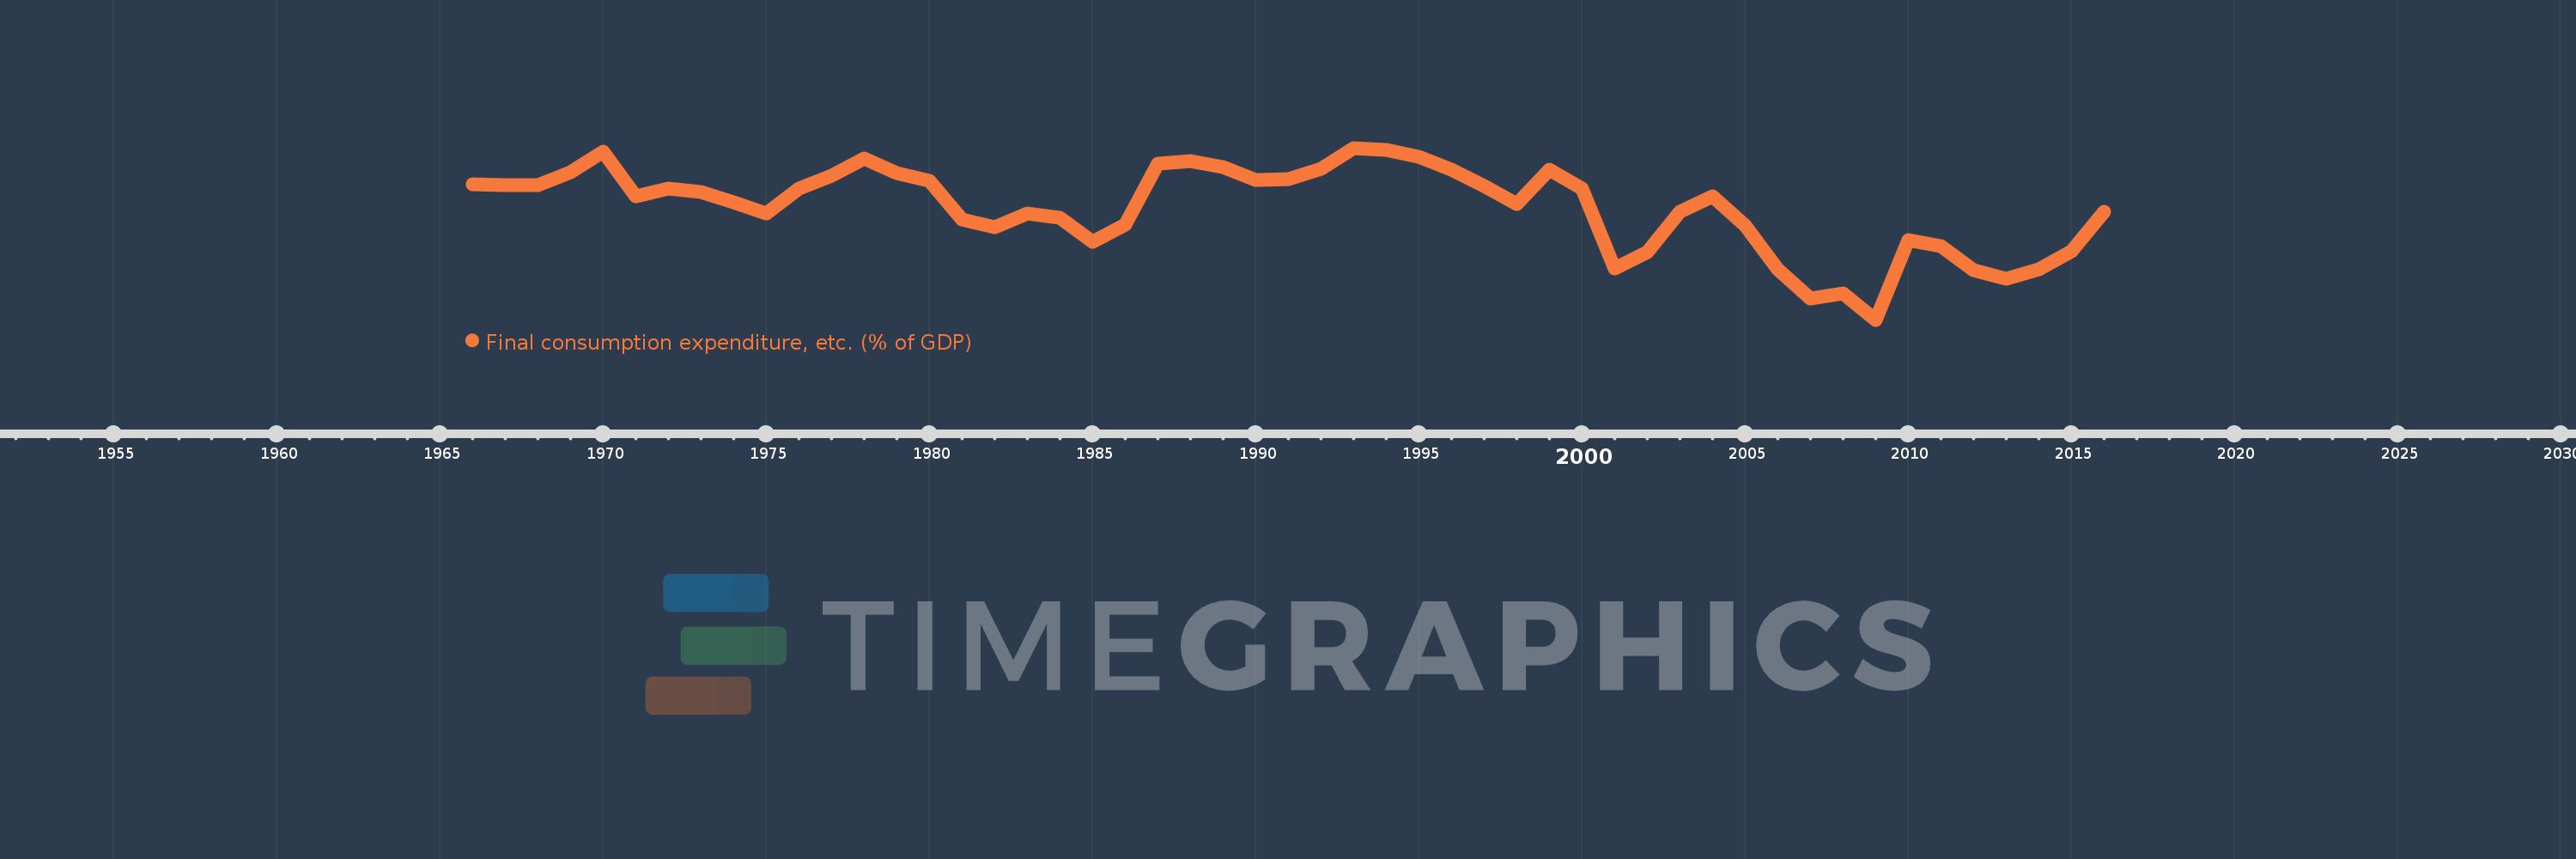
Final consumption expenditure, etc. (% of GDP)
2016,2015,2014,2013,2012,2011,2010,2009,2008,2007,2006,2005,2004,2003,2002,2001,2000,1999,1998,1997,1996,1995,1994,1993,1992,1991,1990,1989,1988,1987,1986,1985,1984,1983,1982,1981,1980,1979,1978,1977,1976,1975,1974,1973,1972,1971,1970,1969,1968,1967,1966
This statistics in other country:
AfghanistanAlbaniaAlgeriaAngolaAntigua and BarbudaArgentinaArmeniaArubaAustraliaAustriaAzerbaijanBahamas, TheBahrainBangladeshBarbadosBelarusBelgiumBelizeBeninBermudaBhutanBoliviaBosnia and HerzegovinaBotswanaBrazilBrunei DarussalamBulgariaBurkina FasoBurundiCabo VerdeCambodiaCameroonCanadaCentral African RepublicChadChileChinaColombiaComorosCongo, Dem. Rep.Congo, Rep.Costa RicaCote d'IvoireCroatiaCubaCyprusCzech RepublicDenmarkDjiboutiDominicaDominican RepublicEcuadorEgypt, Arab Rep.El SalvadorEquatorial GuineaEritreaEstoniaEthiopiaFaroe IslandsFijiFinlandFranceGabonGambia, TheGeorgiaGermanyGhanaGreeceGrenadaGuatemalaGuineaGuinea-BissauGuyanaHaitiHondurasHong Kong SAR, ChinaHungaryIcelandIndiaIndonesiaIran, Islamic Rep.IraqIrelandIsraelItalyJamaicaJapanJordanKazakhstanKenyaKiribatiKorea, Rep.KosovoKuwaitKyrgyz RepublicLao PDRLatviaLebanonLesothoLiberiaLibyaLithuaniaLuxembourgMacao SAR, ChinaMacedonia, FYRMadagascarMalawiMalaysiaMaldivesMaliMaltaMauritaniaMauritiusMexicoMicronesia, Fed. Sts.MoldovaMongoliaMontenegroMoroccoMozambiqueNamibiaNepalNetherlandsNew CaledoniaNew ZealandNicaraguaNigerNigeriaNorwayOmanPakistanPanamaPapua New GuineaParaguayPeruPhilippinesPolandPortugalPuerto RicoQatarRomaniaRussian FederationRwandaSaudi ArabiaSenegalSerbiaSeychellesSierra LeoneSingaporeSlovak RepublicSloveniaSolomon IslandsSomaliaSouth AfricaSouth SudanSpainSri LankaSt. Kitts and NevisSt. LuciaSt. Vincent and the GrenadinesSudanSurinameSwazilandSwedenSwitzerlandSyrian Arab RepublicTajikistanTanzaniaThailandTimor-LesteTogoTongaTrinidad and TobagoTunisiaTurkeyTurkmenistanUgandaUkraineUnited Arab EmiratesUnited KingdomUnited StatesUruguayUzbekistanVanuatuVenezuela, RBVietnamWest Bank and GazaYemen, Rep.ZambiaZimbabwe Timeline:
This timeline shows a graph from 1966 to 2016 of Norway. No data until 1965. Number of actual observations by date: 51.
Source name:
World Development Indicators
Source organization:
World Bank national accounts data, and OECD National Accounts data files.
Categories, topics:
Economy & Growth
Last updated:
apr 23, 2017
Indicators value changes by year
Minimum:
57.027
jan 1, 2009
Maximum:
71.883
jan 1, 1993
At the date of observation
Value
Absolute change
Change from previous value
jan 1, 1966
68.724
+68.724
0.0%
jan 1, 1967
68.656
-0.068
-0.1%
jan 1, 1968
68.683
+0.028
0.04%
jan 1, 1969
69.783
+1.1
1.6%
jan 1, 1970
71.584
+1.801
2.58%
jan 1, 1971
67.717
-3.867
-5.4%
jan 1, 1972
68.394
+0.677
1.0%
jan 1, 1973
68.091
-0.303
-0.44%
jan 1, 1974
67.183
-0.907
-1.33%
jan 1, 1975
66.183
-1.0
-1.49%
jan 1, 1976
68.337
+2.153
3.25%
jan 1, 1977
69.47
+1.133
1.66%
jan 1, 1978
70.994
+1.524
2.19%
jan 1, 1979
69.7
-1.294
-1.82%
jan 1, 1980
69.069
-0.631
-0.91%
jan 1, 1981
65.687
-3.381
-4.9%
jan 1, 1982
65.028
-0.66
-1.0%
jan 1, 1983
66.181
+1.154
1.77%
jan 1, 1984
65.836
-0.346
-0.52%
jan 1, 1985
63.73
-2.106
-3.2%
jan 1, 1986
65.28
+1.551
2.43%
jan 1, 1987
70.493
+5.213
7.99%
jan 1, 1988
70.719
+0.226
0.32%
jan 1, 1989
70.205
-0.514
-0.73%
jan 1, 1990
69.13
-1.074
-1.53%
jan 1, 1991
69.167
+0.036
0.05%
jan 1, 1992
70.098
+0.931
1.35%
jan 1, 1993
71.883
+1.786
2.55%
jan 1, 1994
71.708
-0.176
-0.24%
jan 1, 1995
71.128
-0.58
-0.81%
jan 1, 1996
69.995
-1.133
-1.59%
jan 1, 1997
68.573
-1.421
-2.03%
jan 1, 1998
67.021
-1.553
-2.26%
jan 1, 1999
70.039
+3.018
4.5%
jan 1, 2000
68.341
-1.698
-2.42%
jan 1, 2001
61.449
-6.892
-10.08%
jan 1, 2002
62.877
+1.428
2.32%
jan 1, 2003
66.388
+3.51
5.58%
jan 1, 2004
67.702
+1.315
1.98%
jan 1, 2005
65.162
-2.54
-3.75%
jan 1, 2006
61.407
-3.755
-5.76%
jan 1, 2007
58.888
-2.519
-4.1%
jan 1, 2008
59.296
+0.408
0.69%
jan 1, 2009
57.027
-2.269
-3.83%
jan 1, 2010
63.918
+6.891
12.08%
jan 1, 2011
63.416
-0.502
-0.78%
jan 1, 2012
61.322
-2.094
-3.3%
jan 1, 2013
60.546
-0.777
-1.27%
jan 1, 2014
61.386
+0.84
1.39%
jan 1, 2015
62.949
+1.564
2.55%
jan 1, 2016
66.356
+3.406
5.41%
Ranking of countries by current statistics by years


Comments: