29
/
en
AIzaSyAYiBZKx7MnpbEhh9jyipgxe19OcubqV5w
April 1, 2024
69768
Argentina
ARG
true
2
1
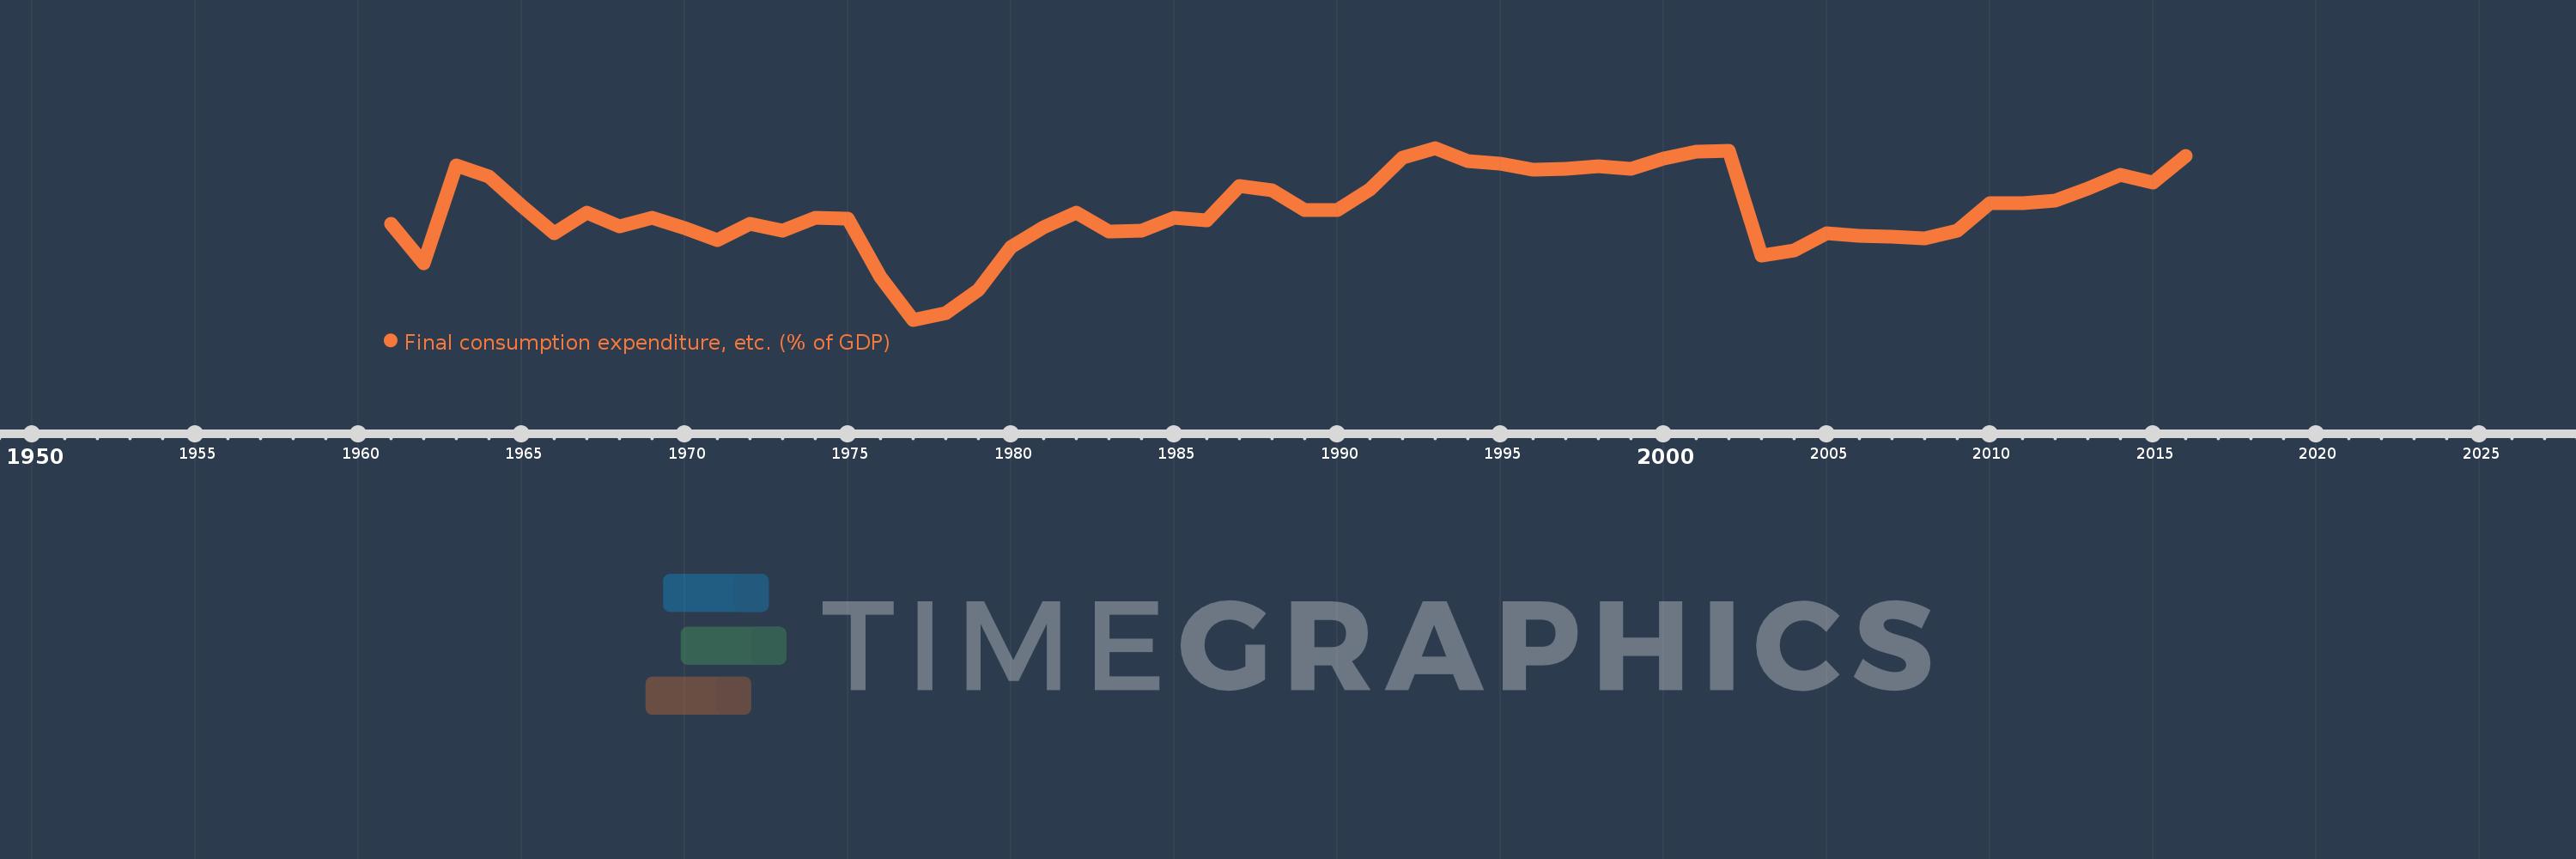
Final consumption expenditure, etc. (% of GDP)
2016,2015,2014,2013,2012,2011,2010,2009,2008,2007,2006,2005,2004,2003,2002,2001,2000,1999,1998,1997,1996,1995,1994,1993,1992,1991,1990,1989,1988,1987,1986,1985,1984,1983,1982,1981,1980,1979,1978,1977,1976,1975,1974,1973,1972,1971,1970,1969,1968,1967,1966,1965,1964,1963,1962,1961
This statistics in other country:
AfghanistanAlbaniaAlgeriaAngolaAntigua and BarbudaArgentinaArmeniaArubaAustraliaAustriaAzerbaijanBahamas, TheBahrainBangladeshBarbadosBelarusBelgiumBelizeBeninBermudaBhutanBoliviaBosnia and HerzegovinaBotswanaBrazilBrunei DarussalamBulgariaBurkina FasoBurundiCabo VerdeCambodiaCameroonCanadaCentral African RepublicChadChileChinaColombiaComorosCongo, Dem. Rep.Congo, Rep.Costa RicaCote d'IvoireCroatiaCubaCyprusCzech RepublicDenmarkDjiboutiDominicaDominican RepublicEcuadorEgypt, Arab Rep.El SalvadorEquatorial GuineaEritreaEstoniaEthiopiaFaroe IslandsFijiFinlandFranceGabonGambia, TheGeorgiaGermanyGhanaGreeceGrenadaGuatemalaGuineaGuinea-BissauGuyanaHaitiHondurasHong Kong SAR, ChinaHungaryIcelandIndiaIndonesiaIran, Islamic Rep.IraqIrelandIsraelItalyJamaicaJapanJordanKazakhstanKenyaKiribatiKorea, Rep.KosovoKuwaitKyrgyz RepublicLao PDRLatviaLebanonLesothoLiberiaLibyaLithuaniaLuxembourgMacao SAR, ChinaMacedonia, FYRMadagascarMalawiMalaysiaMaldivesMaliMaltaMauritaniaMauritiusMexicoMicronesia, Fed. Sts.MoldovaMongoliaMontenegroMoroccoMozambiqueNamibiaNepalNetherlandsNew CaledoniaNew ZealandNicaraguaNigerNigeriaNorwayOmanPakistanPanamaPapua New GuineaParaguayPeruPhilippinesPolandPortugalPuerto RicoQatarRomaniaRussian FederationRwandaSaudi ArabiaSenegalSerbiaSeychellesSierra LeoneSingaporeSlovak RepublicSloveniaSolomon IslandsSomaliaSouth AfricaSouth SudanSpainSri LankaSt. Kitts and NevisSt. LuciaSt. Vincent and the GrenadinesSudanSurinameSwazilandSwedenSwitzerlandSyrian Arab RepublicTajikistanTanzaniaThailandTimor-LesteTogoTongaTrinidad and TobagoTunisiaTurkeyTurkmenistanUgandaUkraineUnited Arab EmiratesUnited KingdomUnited StatesUruguayUzbekistanVanuatuVenezuela, RBVietnamWest Bank and GazaYemen, Rep.ZambiaZimbabwe Timeline:
This timeline shows a graph from 1961 to 2016 of Argentina. No data until 1960. Number of actual observations by date: 56.
Source name:
World Development Indicators
Source organization:
World Bank national accounts data, and OECD National Accounts data files.
Categories, topics:
Economy & Growth
Last updated:
apr 23, 2017
Indicators value changes by year
Minimum:
66.017
jan 1, 1977
Maximum:
84.832
jan 1, 1993
At the date of observation
Value
Absolute change
Change from previous value
jan 1, 1961
76.521
+76.521
0.0%
jan 1, 1962
72.234
-4.287
-5.6%
jan 1, 1963
82.961
+10.727
14.85%
jan 1, 1964
81.727
-1.234
-1.49%
jan 1, 1965
78.526
-3.201
-3.92%
jan 1, 1966
75.497
-3.029
-3.86%
jan 1, 1967
77.794
+2.297
3.04%
jan 1, 1968
76.286
-1.508
-1.94%
jan 1, 1969
77.229
+0.942
1.24%
jan 1, 1970
76.009
-1.219
-1.58%
jan 1, 1971
74.694
-1.315
-1.73%
jan 1, 1972
76.488
+1.793
2.4%
jan 1, 1973
75.749
-0.739
-0.97%
jan 1, 1974
77.203
+1.454
1.92%
jan 1, 1975
77.126
-0.077
-0.1%
jan 1, 1976
70.714
-6.413
-8.31%
jan 1, 1977
66.017
-4.697
-6.64%
jan 1, 1978
66.769
+0.752
1.14%
jan 1, 1979
69.307
+2.538
3.8%
jan 1, 1980
73.962
+4.655
6.72%
jan 1, 1981
76.164
+2.202
2.98%
jan 1, 1982
77.76
+1.596
2.1%
jan 1, 1983
75.676
-2.084
-2.68%
jan 1, 1984
75.797
+0.121
0.16%
jan 1, 1985
77.202
+1.406
1.85%
jan 1, 1986
76.948
-0.254
-0.33%
jan 1, 1987
80.7
+3.752
4.88%
jan 1, 1988
80.148
-0.553
-0.68%
jan 1, 1989
78.04
-2.107
-2.63%
jan 1, 1990
78.006
-0.034
-0.04%
jan 1, 1991
80.275
+2.269
2.91%
jan 1, 1992
83.766
+3.491
4.35%
jan 1, 1993
84.832
+1.066
1.27%
jan 1, 1994
83.348
-1.484
-1.75%
jan 1, 1995
83.135
-0.213
-0.25%
jan 1, 1996
82.473
-0.663
-0.8%
jan 1, 1997
82.567
+0.094
0.11%
jan 1, 1998
82.844
+0.277
0.34%
jan 1, 1999
82.584
-0.26
-0.31%
jan 1, 2000
83.714
+1.13
1.37%
jan 1, 2001
84.457
+0.743
0.89%
jan 1, 2002
84.515
+0.058
0.07%
jan 1, 2003
73.027
-11.488
-13.59%
jan 1, 2004
73.645
+0.618
0.85%
jan 1, 2005
75.446
+1.801
2.45%
jan 1, 2006
75.235
-0.211
-0.28%
jan 1, 2007
75.139
-0.096
-0.13%
jan 1, 2008
74.959
-0.18
-0.24%
jan 1, 2009
75.754
+0.795
1.06%
jan 1, 2010
78.804
+3.05
4.03%
jan 1, 2011
78.784
-0.02
-0.03%
jan 1, 2012
79.025
+0.241
0.31%
jan 1, 2013
80.347
+1.323
1.67%
jan 1, 2014
81.891
+1.544
1.92%
jan 1, 2015
81.042
-0.849
-1.04%
jan 1, 2016
83.962
+2.92
3.6%
Ranking of countries by current statistics by years


Comments: