29
/
en
AIzaSyAYiBZKx7MnpbEhh9jyipgxe19OcubqV5w
April 1, 2024
79408
Barbados
BRB
true
2
1
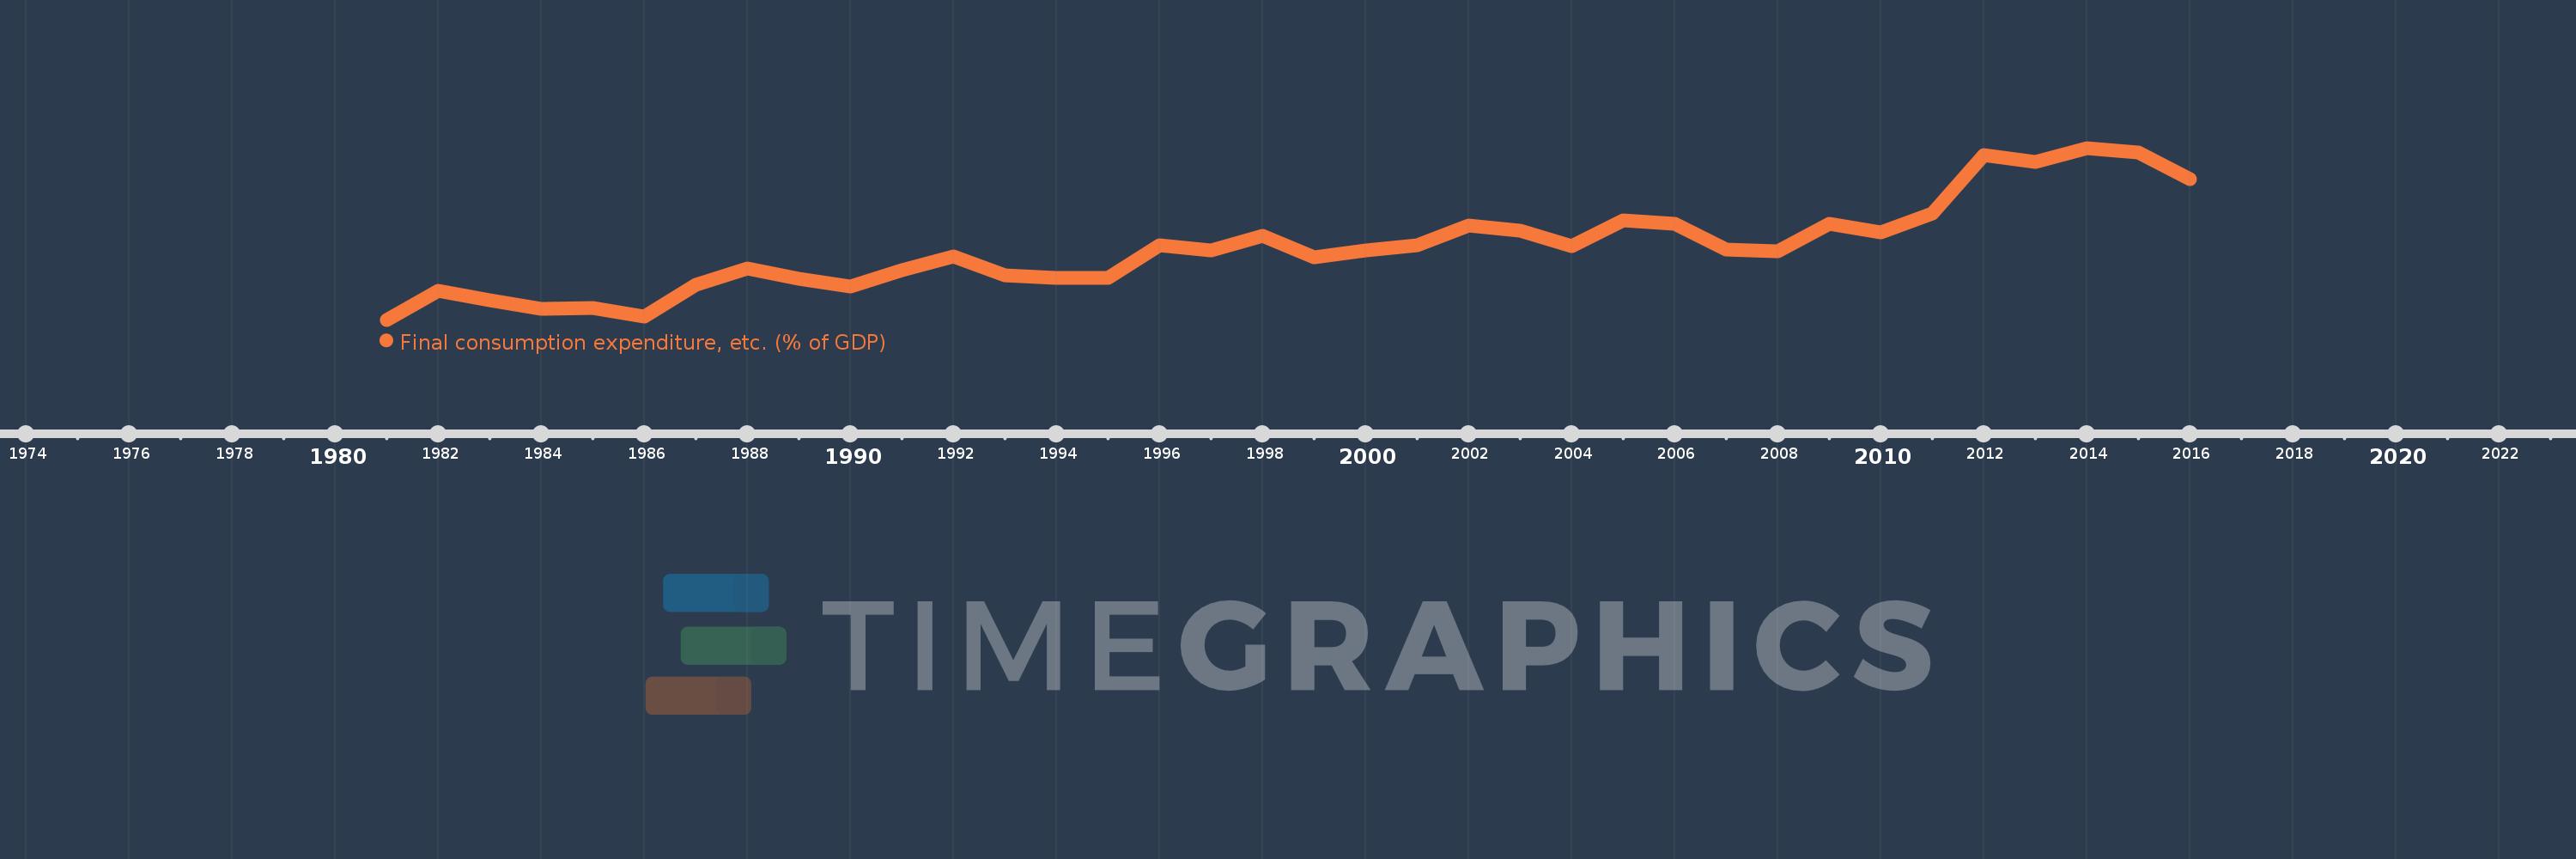
Final consumption expenditure, etc. (% of GDP)
2016,2015,2014,2013,2012,2011,2010,2009,2008,2007,2006,2005,2004,2003,2002,2001,2000,1999,1998,1997,1996,1995,1994,1993,1992,1991,1990,1989,1988,1987,1986,1985,1984,1983,1982,1981
This statistics in other country:
AfghanistanAlbaniaAlgeriaAngolaAntigua and BarbudaArgentinaArmeniaArubaAustraliaAustriaAzerbaijanBahamas, TheBahrainBangladeshBarbadosBelarusBelgiumBelizeBeninBermudaBhutanBoliviaBosnia and HerzegovinaBotswanaBrazilBrunei DarussalamBulgariaBurkina FasoBurundiCabo VerdeCambodiaCameroonCanadaCentral African RepublicChadChileChinaColombiaComorosCongo, Dem. Rep.Congo, Rep.Costa RicaCote d'IvoireCroatiaCubaCyprusCzech RepublicDenmarkDjiboutiDominicaDominican RepublicEcuadorEgypt, Arab Rep.El SalvadorEquatorial GuineaEritreaEstoniaEthiopiaFaroe IslandsFijiFinlandFranceGabonGambia, TheGeorgiaGermanyGhanaGreeceGrenadaGuatemalaGuineaGuinea-BissauGuyanaHaitiHondurasHong Kong SAR, ChinaHungaryIcelandIndiaIndonesiaIran, Islamic Rep.IraqIrelandIsraelItalyJamaicaJapanJordanKazakhstanKenyaKiribatiKorea, Rep.KosovoKuwaitKyrgyz RepublicLao PDRLatviaLebanonLesothoLiberiaLibyaLithuaniaLuxembourgMacao SAR, ChinaMacedonia, FYRMadagascarMalawiMalaysiaMaldivesMaliMaltaMauritaniaMauritiusMexicoMicronesia, Fed. Sts.MoldovaMongoliaMontenegroMoroccoMozambiqueNamibiaNepalNetherlandsNew CaledoniaNew ZealandNicaraguaNigerNigeriaNorwayOmanPakistanPanamaPapua New GuineaParaguayPeruPhilippinesPolandPortugalPuerto RicoQatarRomaniaRussian FederationRwandaSaudi ArabiaSenegalSerbiaSeychellesSierra LeoneSingaporeSlovak RepublicSloveniaSolomon IslandsSomaliaSouth AfricaSouth SudanSpainSri LankaSt. Kitts and NevisSt. LuciaSt. Vincent and the GrenadinesSudanSurinameSwazilandSwedenSwitzerlandSyrian Arab RepublicTajikistanTanzaniaThailandTimor-LesteTogoTongaTrinidad and TobagoTunisiaTurkeyTurkmenistanUgandaUkraineUnited Arab EmiratesUnited KingdomUnited StatesUruguayUzbekistanVanuatuVenezuela, RBVietnamWest Bank and GazaYemen, Rep.ZambiaZimbabwe Timeline:
This timeline shows a graph from 1981 to 2016 of Barbados. No data until 1980. Number of actual observations by date: 36.
Source name:
World Development Indicators
Source organization:
World Bank national accounts data, and OECD National Accounts data files.
Categories, topics:
Economy & Growth
Last updated:
apr 23, 2017
Indicators value changes by year
At the date of observation
Value
Absolute change
Change from previous value
jan 1, 1981
76.16
+76.16
0.0%
jan 1, 1982
80.099
+3.939
5.17%
jan 1, 1983
78.791
-1.308
-1.63%
jan 1, 1984
77.591
-1.2
-1.52%
jan 1, 1985
77.788
+0.197
0.25%
jan 1, 1986
76.537
-1.251
-1.61%
jan 1, 1987
80.961
+4.424
5.78%
jan 1, 1988
83.113
+2.152
2.66%
jan 1, 1989
81.726
-1.387
-1.67%
jan 1, 1990
80.69
-1.036
-1.27%
jan 1, 1991
82.972
+2.282
2.83%
jan 1, 1992
84.787
+1.815
2.19%
jan 1, 1993
82.238
-2.549
-3.01%
jan 1, 1994
81.862
-0.376
-0.46%
jan 1, 1995
81.832
-0.03
-0.04%
jan 1, 1996
86.355
+4.523
5.53%
jan 1, 1997
85.615
-0.74
-0.86%
jan 1, 1998
87.606
+1.99
2.32%
jan 1, 1999
84.654
-2.952
-3.37%
jan 1, 2000
85.599
+0.945
1.12%
jan 1, 2001
86.278
+0.679
0.79%
jan 1, 2002
89.015
+2.737
3.17%
jan 1, 2003
88.335
-0.681
-0.76%
jan 1, 2004
86.192
-2.143
-2.43%
jan 1, 2005
89.647
+3.455
4.01%
jan 1, 2006
89.287
-0.36
-0.4%
jan 1, 2007
85.711
-3.576
-4.0%
jan 1, 2008
85.45
-0.261
-0.3%
jan 1, 2009
89.263
+3.813
4.46%
jan 1, 2010
88.033
-1.23
-1.38%
jan 1, 2011
90.608
+2.575
2.92%
jan 1, 2012
98.623
+8.015
8.85%
jan 1, 2013
97.694
-0.929
-0.94%
jan 1, 2014
99.57
+1.876
1.92%
jan 1, 2015
98.964
-0.606
-0.61%
jan 1, 2016
95.267
-3.697
-3.74%
Ranking of countries by current statistics by years


Comments: