29
/
en
AIzaSyAYiBZKx7MnpbEhh9jyipgxe19OcubqV5w
April 1, 2024
162512
Jamaica
JAM
true
2
1
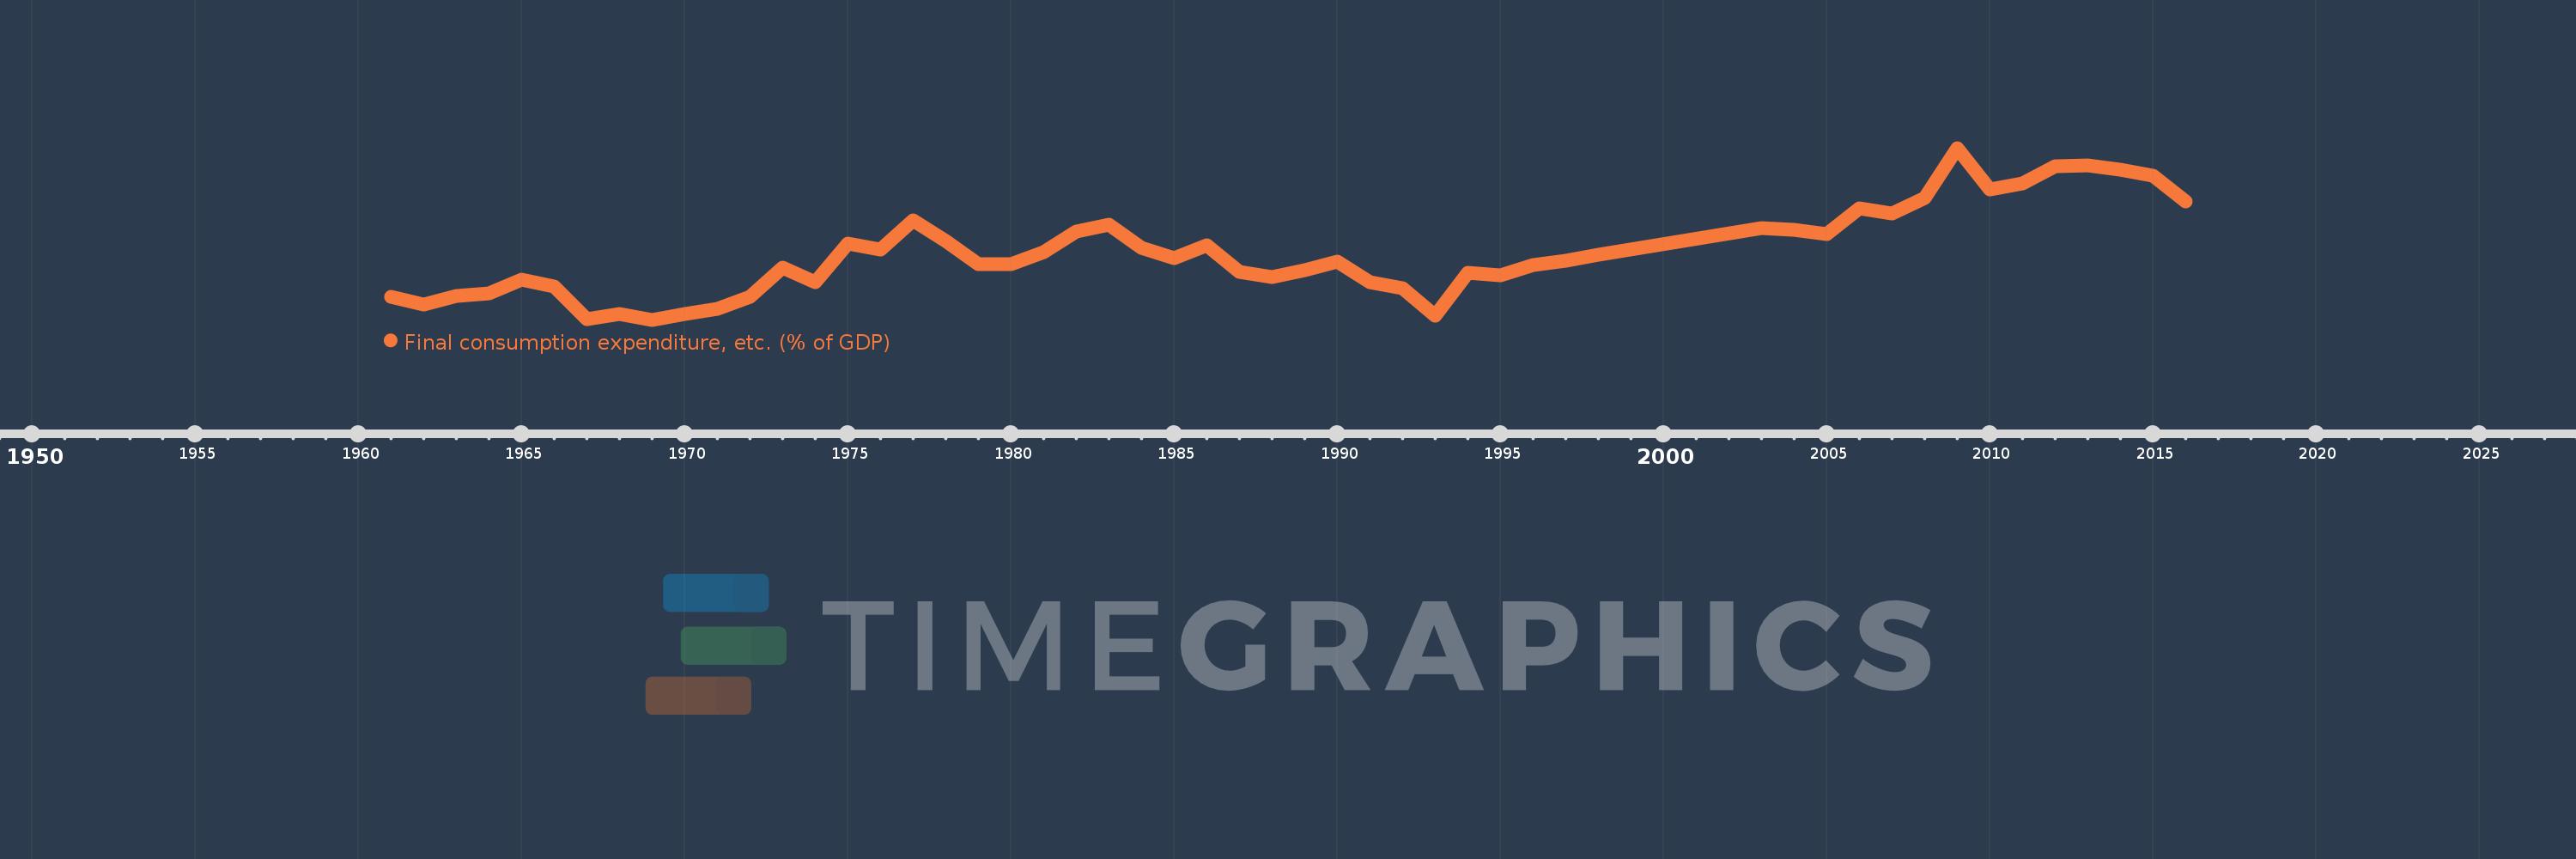
Final consumption expenditure, etc. (% of GDP)
2016,2015,2014,2013,2012,2011,2010,2009,2008,2007,2006,2005,2004,2003,1998,1997,1996,1995,1994,1993,1992,1991,1990,1989,1988,1987,1986,1985,1984,1983,1982,1981,1980,1979,1978,1977,1976,1975,1974,1973,1972,1971,1970,1969,1968,1967,1966,1965,1964,1963,1962,1961
This statistics in other country:
AfghanistanAlbaniaAlgeriaAngolaAntigua and BarbudaArgentinaArmeniaArubaAustraliaAustriaAzerbaijanBahamas, TheBahrainBangladeshBarbadosBelarusBelgiumBelizeBeninBermudaBhutanBoliviaBosnia and HerzegovinaBotswanaBrazilBrunei DarussalamBulgariaBurkina FasoBurundiCabo VerdeCambodiaCameroonCanadaCentral African RepublicChadChileChinaColombiaComorosCongo, Dem. Rep.Congo, Rep.Costa RicaCote d'IvoireCroatiaCubaCyprusCzech RepublicDenmarkDjiboutiDominicaDominican RepublicEcuadorEgypt, Arab Rep.El SalvadorEquatorial GuineaEritreaEstoniaEthiopiaFaroe IslandsFijiFinlandFranceGabonGambia, TheGeorgiaGermanyGhanaGreeceGrenadaGuatemalaGuineaGuinea-BissauGuyanaHaitiHondurasHong Kong SAR, ChinaHungaryIcelandIndiaIndonesiaIran, Islamic Rep.IraqIrelandIsraelItalyJamaicaJapanJordanKazakhstanKenyaKiribatiKorea, Rep.KosovoKuwaitKyrgyz RepublicLao PDRLatviaLebanonLesothoLiberiaLibyaLithuaniaLuxembourgMacao SAR, ChinaMacedonia, FYRMadagascarMalawiMalaysiaMaldivesMaliMaltaMauritaniaMauritiusMexicoMicronesia, Fed. Sts.MoldovaMongoliaMontenegroMoroccoMozambiqueNamibiaNepalNetherlandsNew CaledoniaNew ZealandNicaraguaNigerNigeriaNorwayOmanPakistanPanamaPapua New GuineaParaguayPeruPhilippinesPolandPortugalPuerto RicoQatarRomaniaRussian FederationRwandaSaudi ArabiaSenegalSerbiaSeychellesSierra LeoneSingaporeSlovak RepublicSloveniaSolomon IslandsSomaliaSouth AfricaSouth SudanSpainSri LankaSt. Kitts and NevisSt. LuciaSt. Vincent and the GrenadinesSudanSurinameSwazilandSwedenSwitzerlandSyrian Arab RepublicTajikistanTanzaniaThailandTimor-LesteTogoTongaTrinidad and TobagoTunisiaTurkeyTurkmenistanUgandaUkraineUnited Arab EmiratesUnited KingdomUnited StatesUruguayUzbekistanVanuatuVenezuela, RBVietnamWest Bank and GazaYemen, Rep.ZambiaZimbabwe Timeline:
This timeline shows a graph from 1961 to 2016 of Jamaica. No data until 1960. Number of actual observations by date: 52.
Source name:
World Development Indicators
Source organization:
World Bank national accounts data, and OECD National Accounts data files.
Categories, topics:
Economy & Growth
Last updated:
apr 23, 2017
Indicators value changes by year
Minimum:
70.361
jan 1, 1969
Maximum:
105.341
jan 1, 2009
At the date of observation
Value
Absolute change
Change from previous value
jan 1, 1961
75.085
+75.085
0.0%
jan 1, 1962
73.389
-1.696
-2.26%
jan 1, 1963
75.188
+1.799
2.45%
jan 1, 1964
75.704
+0.516
0.69%
jan 1, 1965
78.597
+2.893
3.82%
jan 1, 1966
77.074
-1.523
-1.94%
jan 1, 1967
70.398
-6.675
-8.66%
jan 1, 1968
71.482
+1.084
1.54%
jan 1, 1969
70.361
-1.121
-1.57%
jan 1, 1970
71.542
+1.181
1.68%
jan 1, 1971
72.647
+1.104
1.54%
jan 1, 1972
75.031
+2.385
3.28%
jan 1, 1973
80.953
+5.922
7.89%
jan 1, 1974
78.08
-2.873
-3.55%
jan 1, 1975
85.907
+7.827
10.02%
jan 1, 1976
84.579
-1.328
-1.55%
jan 1, 1977
90.632
+6.053
7.16%
jan 1, 1978
86.389
-4.243
-4.68%
jan 1, 1979
81.733
-4.656
-5.39%
jan 1, 1980
81.606
-0.127
-0.16%
jan 1, 1981
84.067
+2.461
3.02%
jan 1, 1982
88.319
+4.252
5.06%
jan 1, 1983
89.733
+1.414
1.6%
jan 1, 1984
85.073
-4.66
-5.19%
jan 1, 1985
82.91
-2.163
-2.54%
jan 1, 1986
85.529
+2.619
3.16%
jan 1, 1987
80.099
-5.43
-6.35%
jan 1, 1988
79.017
-1.083
-1.35%
jan 1, 1989
80.533
+1.517
1.92%
jan 1, 1990
82.175
+1.641
2.04%
jan 1, 1991
77.929
-4.245
-5.17%
jan 1, 1992
76.82
-1.11
-1.42%
jan 1, 1993
71.117
-5.703
-7.42%
jan 1, 1994
79.904
+8.787
12.36%
jan 1, 1995
79.35
-0.554
-0.69%
jan 1, 1996
81.532
+2.182
2.75%
jan 1, 1997
82.422
+0.89
1.09%
jan 1, 1998
83.614
+1.192
1.45%
jan 1, 2003
88.985
+5.371
6.42%
jan 1, 2004
88.676
-0.309
-0.35%
jan 1, 2005
87.763
-0.913
-1.03%
jan 1, 2006
92.999
+5.236
5.97%
jan 1, 2007
92.06
-0.939
-1.01%
jan 1, 2008
95.216
+3.156
3.43%
jan 1, 2009
105.341
+10.125
10.63%
jan 1, 2010
96.868
-8.472
-8.04%
jan 1, 2011
98.039
+1.171
1.21%
jan 1, 2012
101.645
+3.606
3.68%
jan 1, 2013
101.725
+0.08
0.08%
jan 1, 2014
100.838
-0.887
-0.87%
jan 1, 2015
99.759
-1.078
-1.07%
jan 1, 2016
94.514
-5.245
-5.26%
Ranking of countries by current statistics by years


Comments: