29
/
en
AIzaSyAYiBZKx7MnpbEhh9jyipgxe19OcubqV5w
April 1, 2024
74956
Azerbaijan
AZE
true
2
1
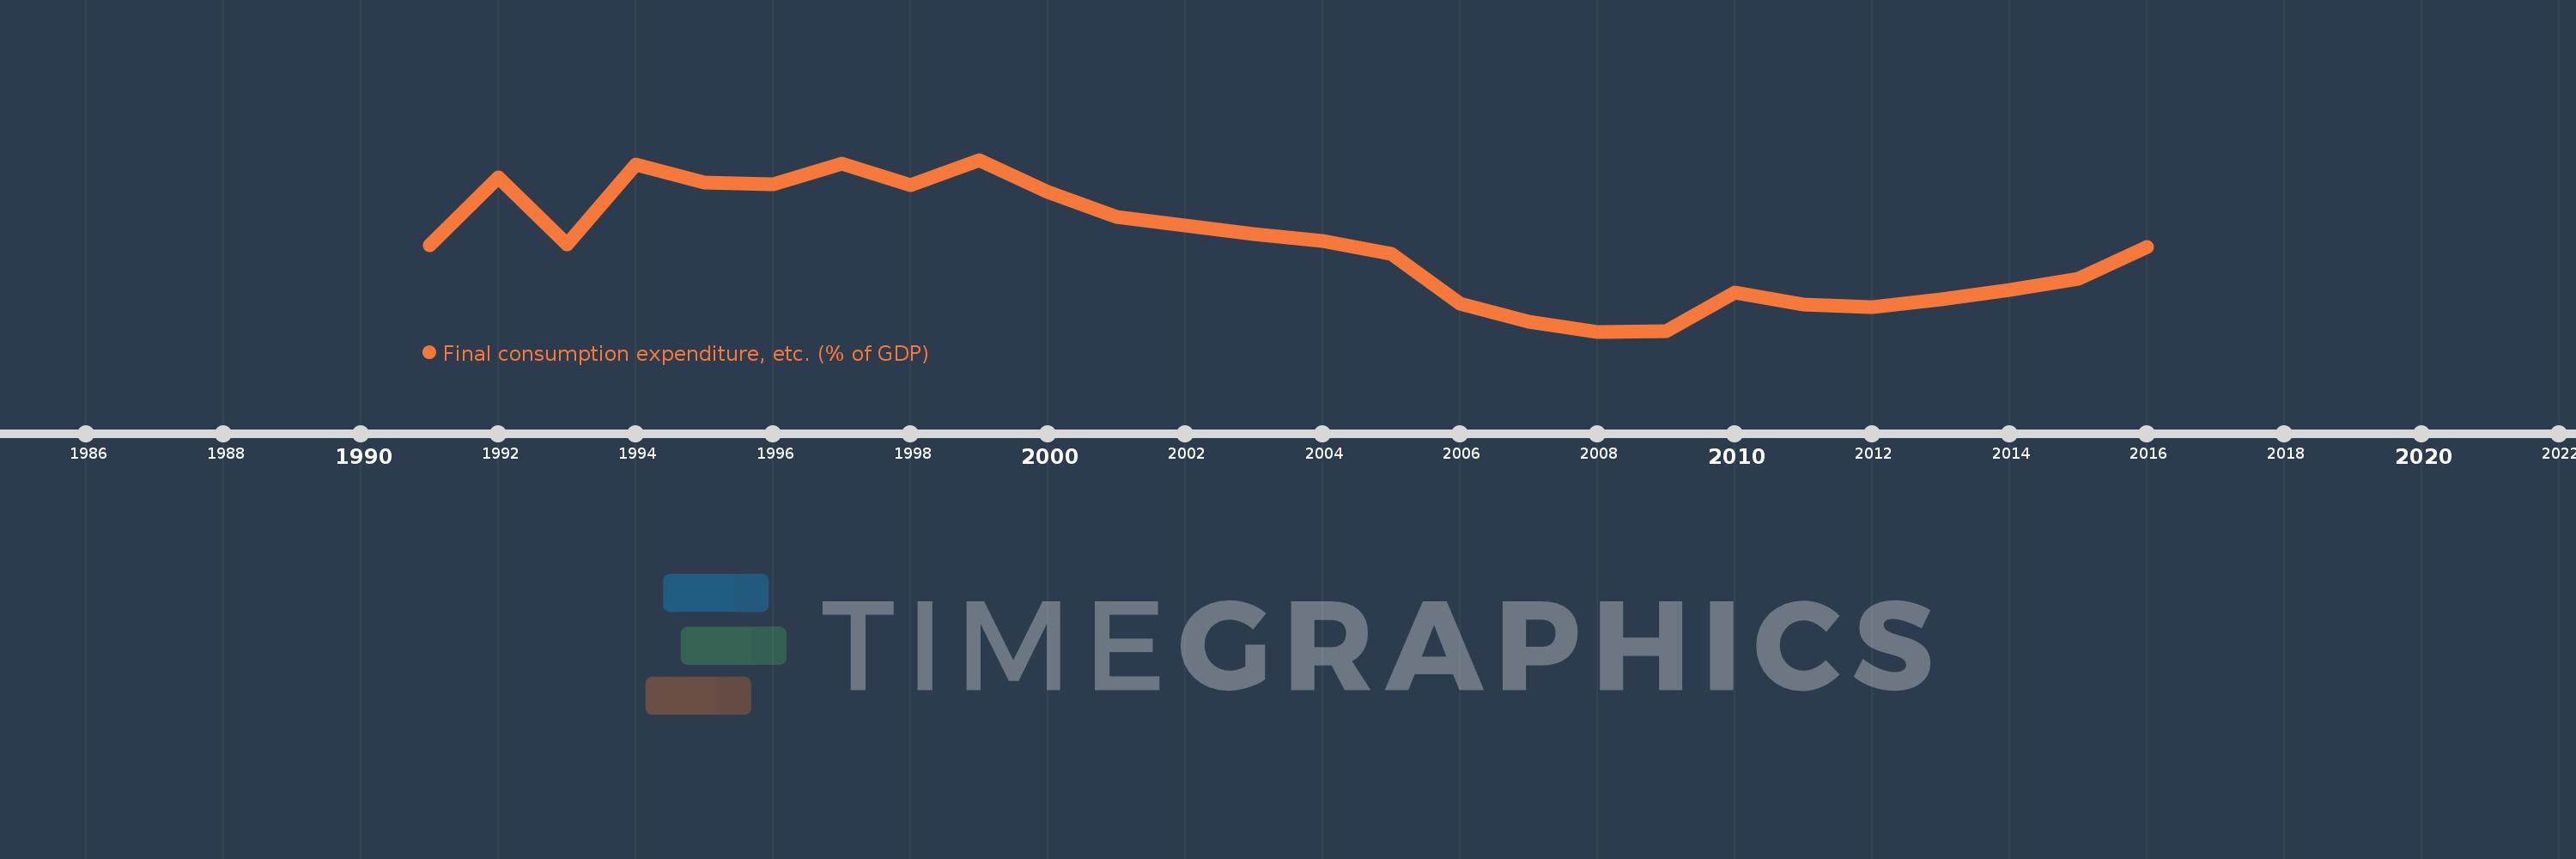
Final consumption expenditure, etc. (% of GDP)
2016,2015,2014,2013,2012,2011,2010,2009,2008,2007,2006,2005,2004,2003,2002,2001,2000,1999,1998,1997,1996,1995,1994,1993,1992,1991
This statistics in other country:
AfghanistanAlbaniaAlgeriaAngolaAntigua and BarbudaArgentinaArmeniaArubaAustraliaAustriaAzerbaijanBahamas, TheBahrainBangladeshBarbadosBelarusBelgiumBelizeBeninBermudaBhutanBoliviaBosnia and HerzegovinaBotswanaBrazilBrunei DarussalamBulgariaBurkina FasoBurundiCabo VerdeCambodiaCameroonCanadaCentral African RepublicChadChileChinaColombiaComorosCongo, Dem. Rep.Congo, Rep.Costa RicaCote d'IvoireCroatiaCubaCyprusCzech RepublicDenmarkDjiboutiDominicaDominican RepublicEcuadorEgypt, Arab Rep.El SalvadorEquatorial GuineaEritreaEstoniaEthiopiaFaroe IslandsFijiFinlandFranceGabonGambia, TheGeorgiaGermanyGhanaGreeceGrenadaGuatemalaGuineaGuinea-BissauGuyanaHaitiHondurasHong Kong SAR, ChinaHungaryIcelandIndiaIndonesiaIran, Islamic Rep.IraqIrelandIsraelItalyJamaicaJapanJordanKazakhstanKenyaKiribatiKorea, Rep.KosovoKuwaitKyrgyz RepublicLao PDRLatviaLebanonLesothoLiberiaLibyaLithuaniaLuxembourgMacao SAR, ChinaMacedonia, FYRMadagascarMalawiMalaysiaMaldivesMaliMaltaMauritaniaMauritiusMexicoMicronesia, Fed. Sts.MoldovaMongoliaMontenegroMoroccoMozambiqueNamibiaNepalNetherlandsNew CaledoniaNew ZealandNicaraguaNigerNigeriaNorwayOmanPakistanPanamaPapua New GuineaParaguayPeruPhilippinesPolandPortugalPuerto RicoQatarRomaniaRussian FederationRwandaSaudi ArabiaSenegalSerbiaSeychellesSierra LeoneSingaporeSlovak RepublicSloveniaSolomon IslandsSomaliaSouth AfricaSouth SudanSpainSri LankaSt. Kitts and NevisSt. LuciaSt. Vincent and the GrenadinesSudanSurinameSwazilandSwedenSwitzerlandSyrian Arab RepublicTajikistanTanzaniaThailandTimor-LesteTogoTongaTrinidad and TobagoTunisiaTurkeyTurkmenistanUgandaUkraineUnited Arab EmiratesUnited KingdomUnited StatesUruguayUzbekistanVanuatuVenezuela, RBVietnamWest Bank and GazaYemen, Rep.ZambiaZimbabwe Timeline:
This timeline shows a graph from 1991 to 2016 of Azerbaijan. No data until 1990. Number of actual observations by date: 26.
Source name:
World Development Indicators
Source organization:
World Bank national accounts data, and OECD National Accounts data files.
Categories, topics:
Economy & Growth
Last updated:
apr 23, 2017
Indicators value changes by year
Minimum:
38.858
jan 1, 2008
Maximum:
98.461
jan 1, 1999
At the date of observation
Value
Absolute change
Change from previous value
jan 1, 1991
68.827
+68.827
0.0%
jan 1, 1992
92.459
+23.632
34.34%
jan 1, 1993
69.084
-23.375
-25.28%
jan 1, 1994
96.77
+27.686
40.08%
jan 1, 1995
90.593
-6.176
-6.38%
jan 1, 1996
89.83
-0.763
-0.84%
jan 1, 1997
97.034
+7.204
8.02%
jan 1, 1998
89.767
-7.266
-7.49%
jan 1, 1999
98.461
+8.694
9.68%
jan 1, 2000
87.398
-11.063
-11.24%
jan 1, 2001
78.663
-8.735
-10.0%
jan 1, 2002
75.72
-2.943
-3.74%
jan 1, 2003
72.704
-3.015
-3.98%
jan 1, 2004
70.37
-2.334
-3.21%
jan 1, 2005
65.938
-4.432
-6.3%
jan 1, 2006
48.426
-17.512
-26.56%
jan 1, 2007
42.394
-6.032
-12.46%
jan 1, 2008
38.858
-3.536
-8.34%
jan 1, 2009
38.997
+0.139
0.36%
jan 1, 2010
52.524
+13.527
34.69%
jan 1, 2011
48.317
-4.207
-8.01%
jan 1, 2012
47.386
-0.931
-1.93%
jan 1, 2013
49.976
+2.59
5.47%
jan 1, 2014
53.438
+3.462
6.93%
jan 1, 2015
57.175
+3.736
6.99%
jan 1, 2016
68.324
+11.15
19.5%
Ranking of countries by current statistics by years


Comments: