29
/
en
AIzaSyAYiBZKx7MnpbEhh9jyipgxe19OcubqV5w
April 1, 2024
89759
Botswana
BWA
true
2
1
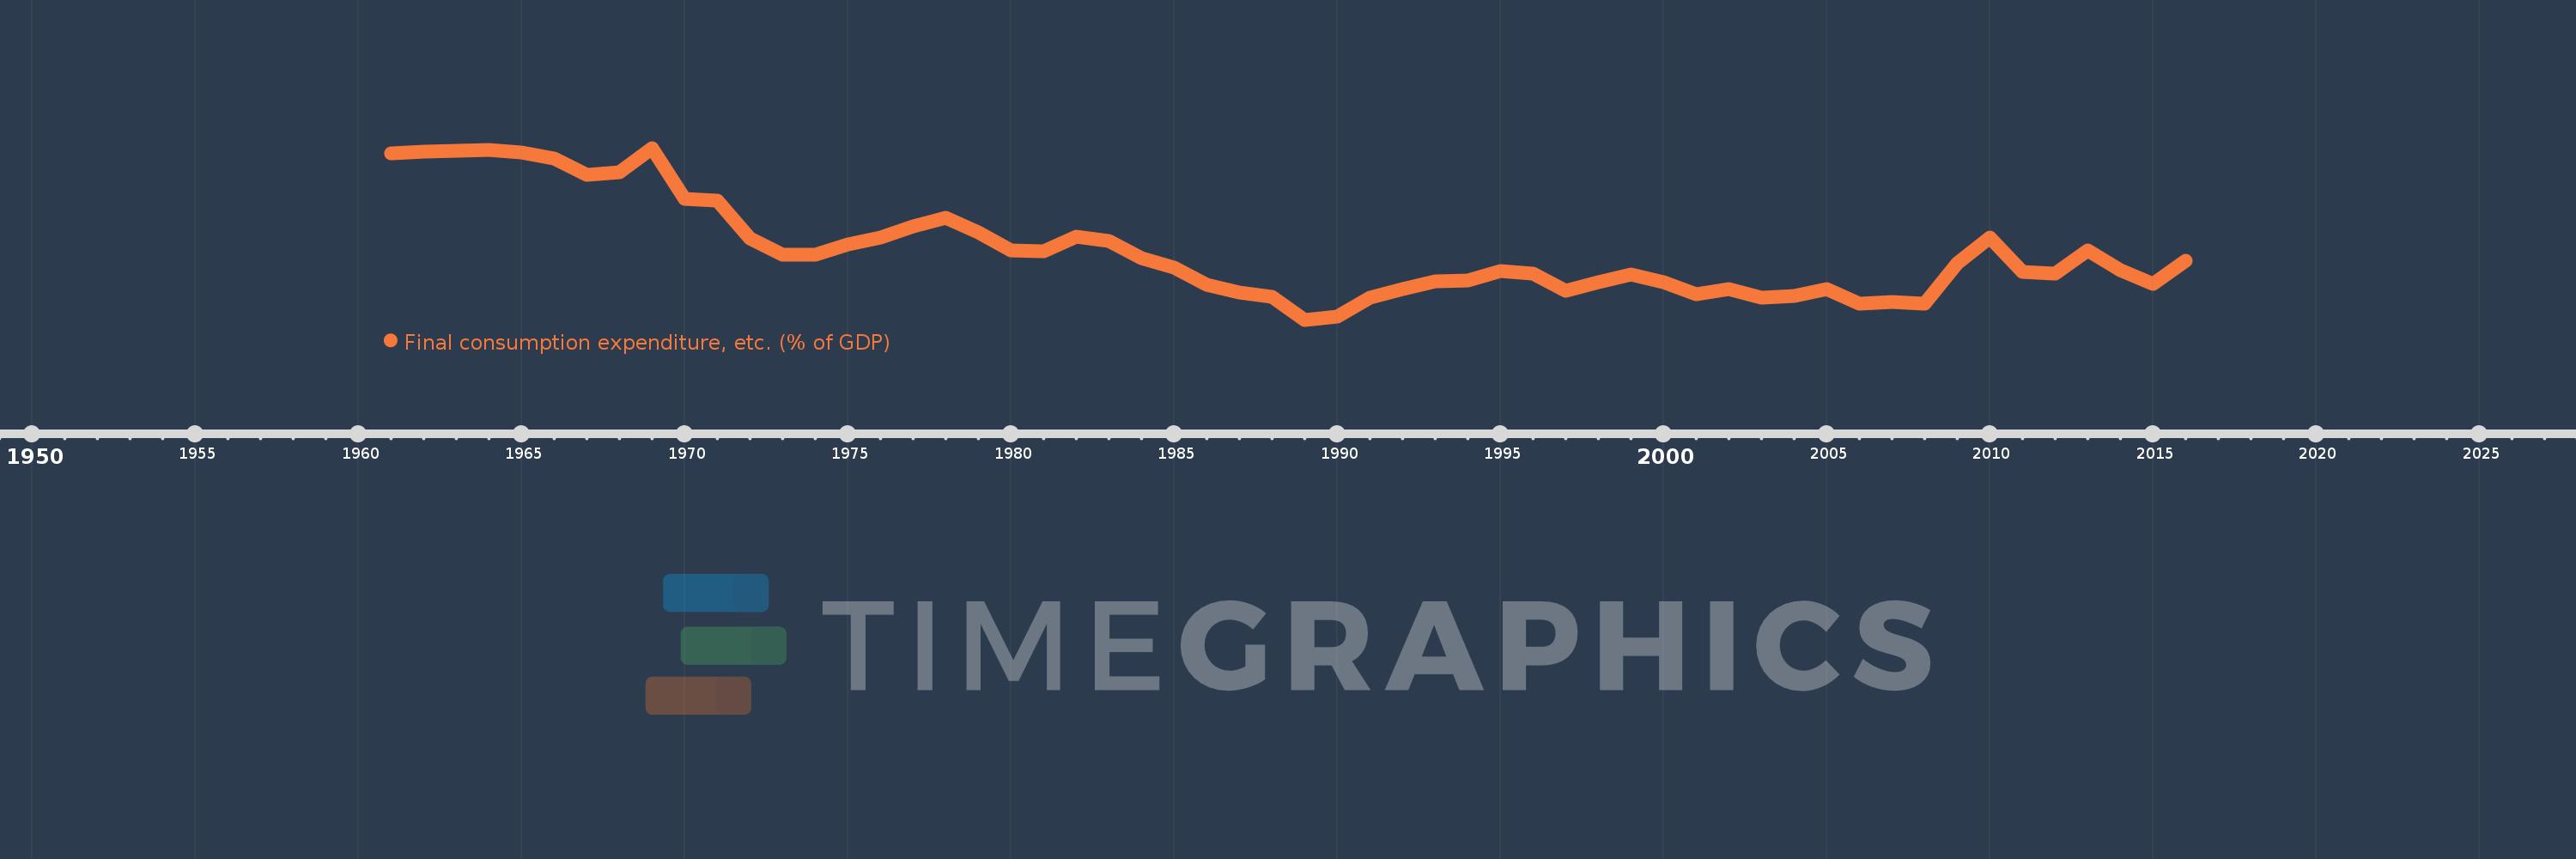
Final consumption expenditure, etc. (% of GDP)
2016,2015,2014,2013,2012,2011,2010,2009,2008,2007,2006,2005,2004,2003,2002,2001,2000,1999,1998,1997,1996,1995,1994,1993,1992,1991,1990,1989,1988,1987,1986,1985,1984,1983,1982,1981,1980,1979,1978,1977,1976,1975,1974,1973,1972,1971,1970,1969,1968,1967,1966,1965,1964,1963,1962,1961
This statistics in other country:
AfghanistanAlbaniaAlgeriaAngolaAntigua and BarbudaArgentinaArmeniaArubaAustraliaAustriaAzerbaijanBahamas, TheBahrainBangladeshBarbadosBelarusBelgiumBelizeBeninBermudaBhutanBoliviaBosnia and HerzegovinaBotswanaBrazilBrunei DarussalamBulgariaBurkina FasoBurundiCabo VerdeCambodiaCameroonCanadaCentral African RepublicChadChileChinaColombiaComorosCongo, Dem. Rep.Congo, Rep.Costa RicaCote d'IvoireCroatiaCubaCyprusCzech RepublicDenmarkDjiboutiDominicaDominican RepublicEcuadorEgypt, Arab Rep.El SalvadorEquatorial GuineaEritreaEstoniaEthiopiaFaroe IslandsFijiFinlandFranceGabonGambia, TheGeorgiaGermanyGhanaGreeceGrenadaGuatemalaGuineaGuinea-BissauGuyanaHaitiHondurasHong Kong SAR, ChinaHungaryIcelandIndiaIndonesiaIran, Islamic Rep.IraqIrelandIsraelItalyJamaicaJapanJordanKazakhstanKenyaKiribatiKorea, Rep.KosovoKuwaitKyrgyz RepublicLao PDRLatviaLebanonLesothoLiberiaLibyaLithuaniaLuxembourgMacao SAR, ChinaMacedonia, FYRMadagascarMalawiMalaysiaMaldivesMaliMaltaMauritaniaMauritiusMexicoMicronesia, Fed. Sts.MoldovaMongoliaMontenegroMoroccoMozambiqueNamibiaNepalNetherlandsNew CaledoniaNew ZealandNicaraguaNigerNigeriaNorwayOmanPakistanPanamaPapua New GuineaParaguayPeruPhilippinesPolandPortugalPuerto RicoQatarRomaniaRussian FederationRwandaSaudi ArabiaSenegalSerbiaSeychellesSierra LeoneSingaporeSlovak RepublicSloveniaSolomon IslandsSomaliaSouth AfricaSouth SudanSpainSri LankaSt. Kitts and NevisSt. LuciaSt. Vincent and the GrenadinesSudanSurinameSwazilandSwedenSwitzerlandSyrian Arab RepublicTajikistanTanzaniaThailandTimor-LesteTogoTongaTrinidad and TobagoTunisiaTurkeyTurkmenistanUgandaUkraineUnited Arab EmiratesUnited KingdomUnited StatesUruguayUzbekistanVanuatuVenezuela, RBVietnamWest Bank and GazaYemen, Rep.ZambiaZimbabwe Timeline:
This timeline shows a graph from 1961 to 2016 of Botswana. No data until 1960. Number of actual observations by date: 56.
Source name:
World Development Indicators
Source organization:
World Bank national accounts data, and OECD National Accounts data files.
Categories, topics:
Economy & Growth
Last updated:
apr 23, 2017
Indicators value changes by year
Minimum:
49.823
jan 1, 1989
Maximum:
109.158
jan 1, 1969
At the date of observation
Value
Absolute change
Change from previous value
jan 1, 1961
107.353
+107.353
0.0%
jan 1, 1962
107.91
+0.557
0.52%
jan 1, 1963
108.114
+0.204
0.19%
jan 1, 1964
108.544
+0.43
0.4%
jan 1, 1965
107.483
-1.061
-0.98%
jan 1, 1966
105.64
-1.843
-1.71%
jan 1, 1967
99.864
-5.776
-5.47%
jan 1, 1968
100.713
+0.849
0.85%
jan 1, 1969
109.158
+8.444
8.38%
jan 1, 1970
91.539
-17.619
-16.14%
jan 1, 1971
90.935
-0.604
-0.66%
jan 1, 1972
77.974
-12.962
-14.25%
jan 1, 1973
72.227
-5.747
-7.37%
jan 1, 1974
72.234
+0.007
0.01%
jan 1, 1975
75.98
+3.746
5.19%
jan 1, 1976
78.298
+2.318
3.05%
jan 1, 1977
82.164
+3.866
4.94%
jan 1, 1978
84.944
+2.78
3.38%
jan 1, 1979
80.1
-4.844
-5.7%
jan 1, 1980
73.908
-6.193
-7.73%
jan 1, 1981
73.331
-0.577
-0.78%
jan 1, 1982
78.42
+5.089
6.94%
jan 1, 1983
77.054
-1.366
-1.74%
jan 1, 1984
71.093
-5.961
-7.74%
jan 1, 1985
67.707
-3.386
-4.76%
jan 1, 1986
61.946
-5.761
-8.51%
jan 1, 1987
59.313
-2.634
-4.25%
jan 1, 1988
57.812
-1.501
-2.53%
jan 1, 1989
49.823
-7.989
-13.82%
jan 1, 1990
50.803
+0.98
1.97%
jan 1, 1991
57.37
+6.566
12.92%
jan 1, 1992
60.289
+2.92
5.09%
jan 1, 1993
62.973
+2.684
4.45%
jan 1, 1994
63.237
+0.264
0.42%
jan 1, 1995
66.553
+3.316
5.24%
jan 1, 1996
65.792
-0.761
-1.14%
jan 1, 1997
59.855
-5.937
-9.02%
jan 1, 1998
62.791
+2.936
4.9%
jan 1, 1999
65.326
+2.535
4.04%
jan 1, 2000
62.909
-2.417
-3.7%
jan 1, 2001
58.71
-4.199
-6.67%
jan 1, 2002
60.322
+1.612
2.75%
jan 1, 2003
57.327
-2.995
-4.96%
jan 1, 2004
58.037
+0.71
1.24%
jan 1, 2005
60.291
+2.253
3.88%
jan 1, 2006
55.508
-4.783
-7.93%
jan 1, 2007
55.921
+0.413
0.74%
jan 1, 2008
55.28
-0.641
-1.15%
jan 1, 2009
69.181
+13.901
25.15%
jan 1, 2010
78.154
+8.973
12.97%
jan 1, 2011
66.217
-11.937
-15.27%
jan 1, 2012
65.806
-0.411
-0.62%
jan 1, 2013
73.796
+7.99
12.14%
jan 1, 2014
67.046
-6.75
-9.15%
jan 1, 2015
62.322
-4.724
-7.05%
jan 1, 2016
70.196
+7.874
12.63%
Ranking of countries by current statistics by years


Comments: