29
/
en
AIzaSyAYiBZKx7MnpbEhh9jyipgxe19OcubqV5w
April 1, 2024
127313
Equatorial Guinea
GNQ
true
2
1
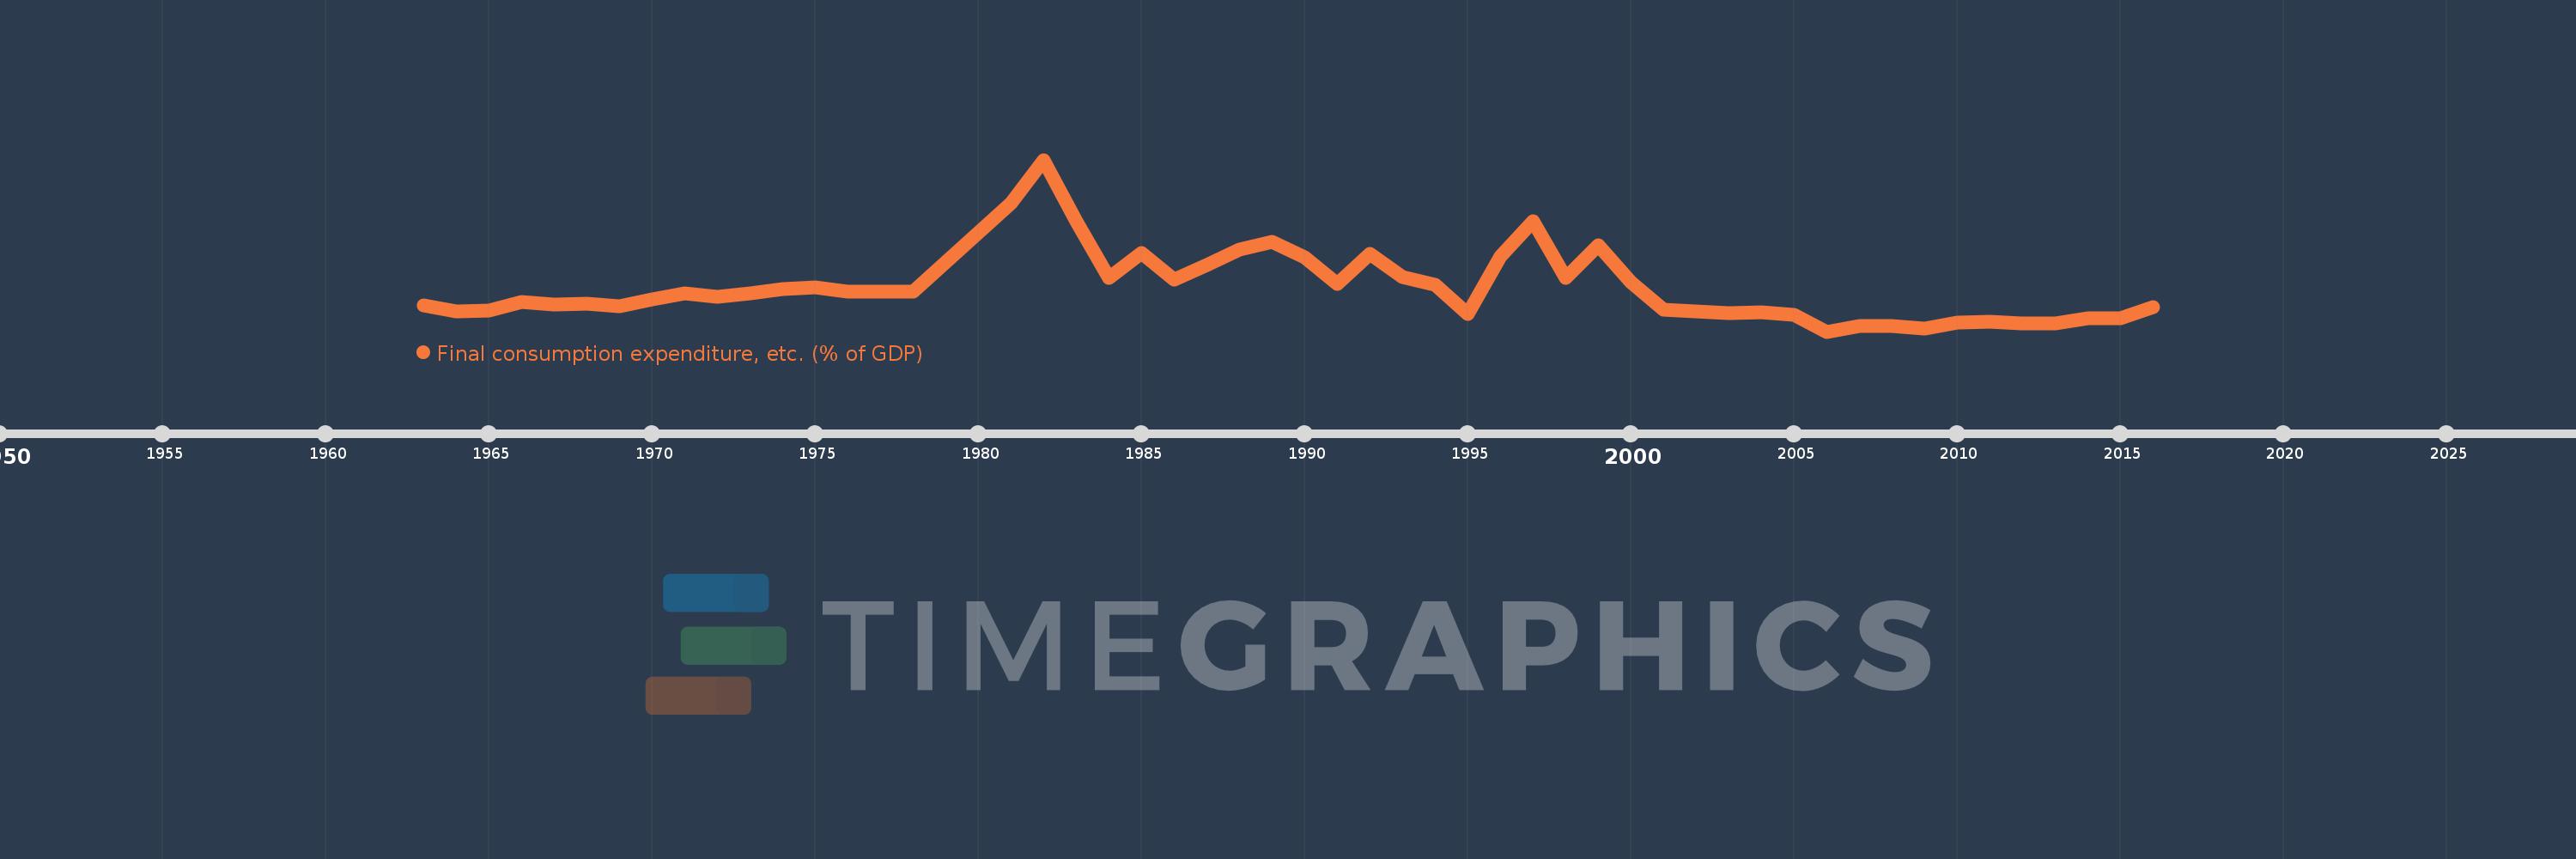
Final consumption expenditure, etc. (% of GDP)
2016,2015,2014,2013,2012,2011,2010,2009,2008,2007,2006,2005,2004,2003,2002,2001,2000,1999,1998,1997,1996,1995,1994,1993,1992,1991,1990,1989,1988,1987,1986,1985,1984,1983,1982,1981,1978,1977,1976,1975,1974,1973,1972,1971,1970,1969,1968,1967,1966,1965,1964,1963
This statistics in other country:
AfghanistanAlbaniaAlgeriaAngolaAntigua and BarbudaArgentinaArmeniaArubaAustraliaAustriaAzerbaijanBahamas, TheBahrainBangladeshBarbadosBelarusBelgiumBelizeBeninBermudaBhutanBoliviaBosnia and HerzegovinaBotswanaBrazilBrunei DarussalamBulgariaBurkina FasoBurundiCabo VerdeCambodiaCameroonCanadaCentral African RepublicChadChileChinaColombiaComorosCongo, Dem. Rep.Congo, Rep.Costa RicaCote d'IvoireCroatiaCubaCyprusCzech RepublicDenmarkDjiboutiDominicaDominican RepublicEcuadorEgypt, Arab Rep.El SalvadorEquatorial GuineaEritreaEstoniaEthiopiaFaroe IslandsFijiFinlandFranceGabonGambia, TheGeorgiaGermanyGhanaGreeceGrenadaGuatemalaGuineaGuinea-BissauGuyanaHaitiHondurasHong Kong SAR, ChinaHungaryIcelandIndiaIndonesiaIran, Islamic Rep.IraqIrelandIsraelItalyJamaicaJapanJordanKazakhstanKenyaKiribatiKorea, Rep.KosovoKuwaitKyrgyz RepublicLao PDRLatviaLebanonLesothoLiberiaLibyaLithuaniaLuxembourgMacao SAR, ChinaMacedonia, FYRMadagascarMalawiMalaysiaMaldivesMaliMaltaMauritaniaMauritiusMexicoMicronesia, Fed. Sts.MoldovaMongoliaMontenegroMoroccoMozambiqueNamibiaNepalNetherlandsNew CaledoniaNew ZealandNicaraguaNigerNigeriaNorwayOmanPakistanPanamaPapua New GuineaParaguayPeruPhilippinesPolandPortugalPuerto RicoQatarRomaniaRussian FederationRwandaSaudi ArabiaSenegalSerbiaSeychellesSierra LeoneSingaporeSlovak RepublicSloveniaSolomon IslandsSomaliaSouth AfricaSouth SudanSpainSri LankaSt. Kitts and NevisSt. LuciaSt. Vincent and the GrenadinesSudanSurinameSwazilandSwedenSwitzerlandSyrian Arab RepublicTajikistanTanzaniaThailandTimor-LesteTogoTongaTrinidad and TobagoTunisiaTurkeyTurkmenistanUgandaUkraineUnited Arab EmiratesUnited KingdomUnited StatesUruguayUzbekistanVanuatuVenezuela, RBVietnamWest Bank and GazaYemen, Rep.ZambiaZimbabwe Timeline:
This timeline shows a graph from 1963 to 2016 of Equatorial Guinea. No data until 1962. Number of actual observations by date: 52.
Source name:
World Development Indicators
Source organization:
World Bank national accounts data, and OECD National Accounts data files.
Categories, topics:
Economy & Growth
Last updated:
apr 23, 2017
Indicators value changes by year
Minimum:
16.713
jan 1, 2006
Maximum:
341.855
jan 1, 1982
At the date of observation
Value
Absolute change
Change from previous value
jan 1, 1963
66.714
+66.714
0.0%
jan 1, 1964
54.33
-12.385
-18.56%
jan 1, 1965
56.917
+2.587
4.76%
jan 1, 1966
72.303
+15.386
27.03%
jan 1, 1967
68.673
-3.63
-5.02%
jan 1, 1968
69.863
+1.19
1.73%
jan 1, 1969
64.769
-5.093
-7.29%
jan 1, 1970
77.411
+12.641
19.52%
jan 1, 1971
89.514
+12.103
15.63%
jan 1, 1972
82.634
-6.879
-7.69%
jan 1, 1973
88.757
+6.122
7.41%
jan 1, 1974
97.174
+8.417
9.48%
jan 1, 1975
99.869
+2.695
2.77%
jan 1, 1976
92.85
-7.019
-7.03%
jan 1, 1977
92.317
-0.533
-0.57%
jan 1, 1978
92.174
-0.143
-0.16%
jan 1, 1981
259.835
+167.661
181.9%
jan 1, 1982
341.855
+82.02
31.57%
jan 1, 1983
226.422
-115.434
-33.77%
jan 1, 1984
118.147
-108.275
-47.82%
jan 1, 1985
164.684
+46.537
39.39%
jan 1, 1986
114.521
-50.164
-30.46%
jan 1, 1987
142.19
+27.669
24.16%
jan 1, 1988
171.663
+29.473
20.73%
jan 1, 1989
187.401
+15.738
9.17%
jan 1, 1990
157.53
-29.871
-15.94%
jan 1, 1991
107.503
-50.027
-31.76%
jan 1, 1992
163.789
+56.286
52.36%
jan 1, 1993
119.988
-43.801
-26.74%
jan 1, 1994
105.151
-14.837
-12.37%
jan 1, 1995
49.287
-55.864
-53.13%
jan 1, 1996
159.415
+110.128
223.44%
jan 1, 1997
225.681
+66.266
41.57%
jan 1, 1998
118.291
-107.391
-47.59%
jan 1, 1999
180.857
+62.566
52.89%
jan 1, 2000
110.367
-70.49
-38.98%
jan 1, 2001
58.957
-51.41
-46.58%
jan 1, 2002
54.44
-4.517
-7.66%
jan 1, 2003
50.913
-3.528
-6.48%
jan 1, 2004
53.084
+2.171
4.26%
jan 1, 2005
47.761
-5.323
-10.03%
jan 1, 2006
16.713
-31.048
-65.01%
jan 1, 2007
27.38
+10.667
63.83%
jan 1, 2008
27.255
-0.125
-0.46%
jan 1, 2009
22.698
-4.558
-16.72%
jan 1, 2010
34.135
+11.437
50.39%
jan 1, 2011
35.095
+0.96
2.81%
jan 1, 2012
32.137
-2.958
-8.43%
jan 1, 2013
31.717
-0.42
-1.31%
jan 1, 2014
41.279
+9.561
30.15%
jan 1, 2015
42.569
+1.29
3.13%
jan 1, 2016
63.724
+21.156
49.7%
Ranking of countries by current statistics by years


Comments: