29
/
en
AIzaSyAYiBZKx7MnpbEhh9jyipgxe19OcubqV5w
April 1, 2024
141767
Greece
GRC
true
2
1
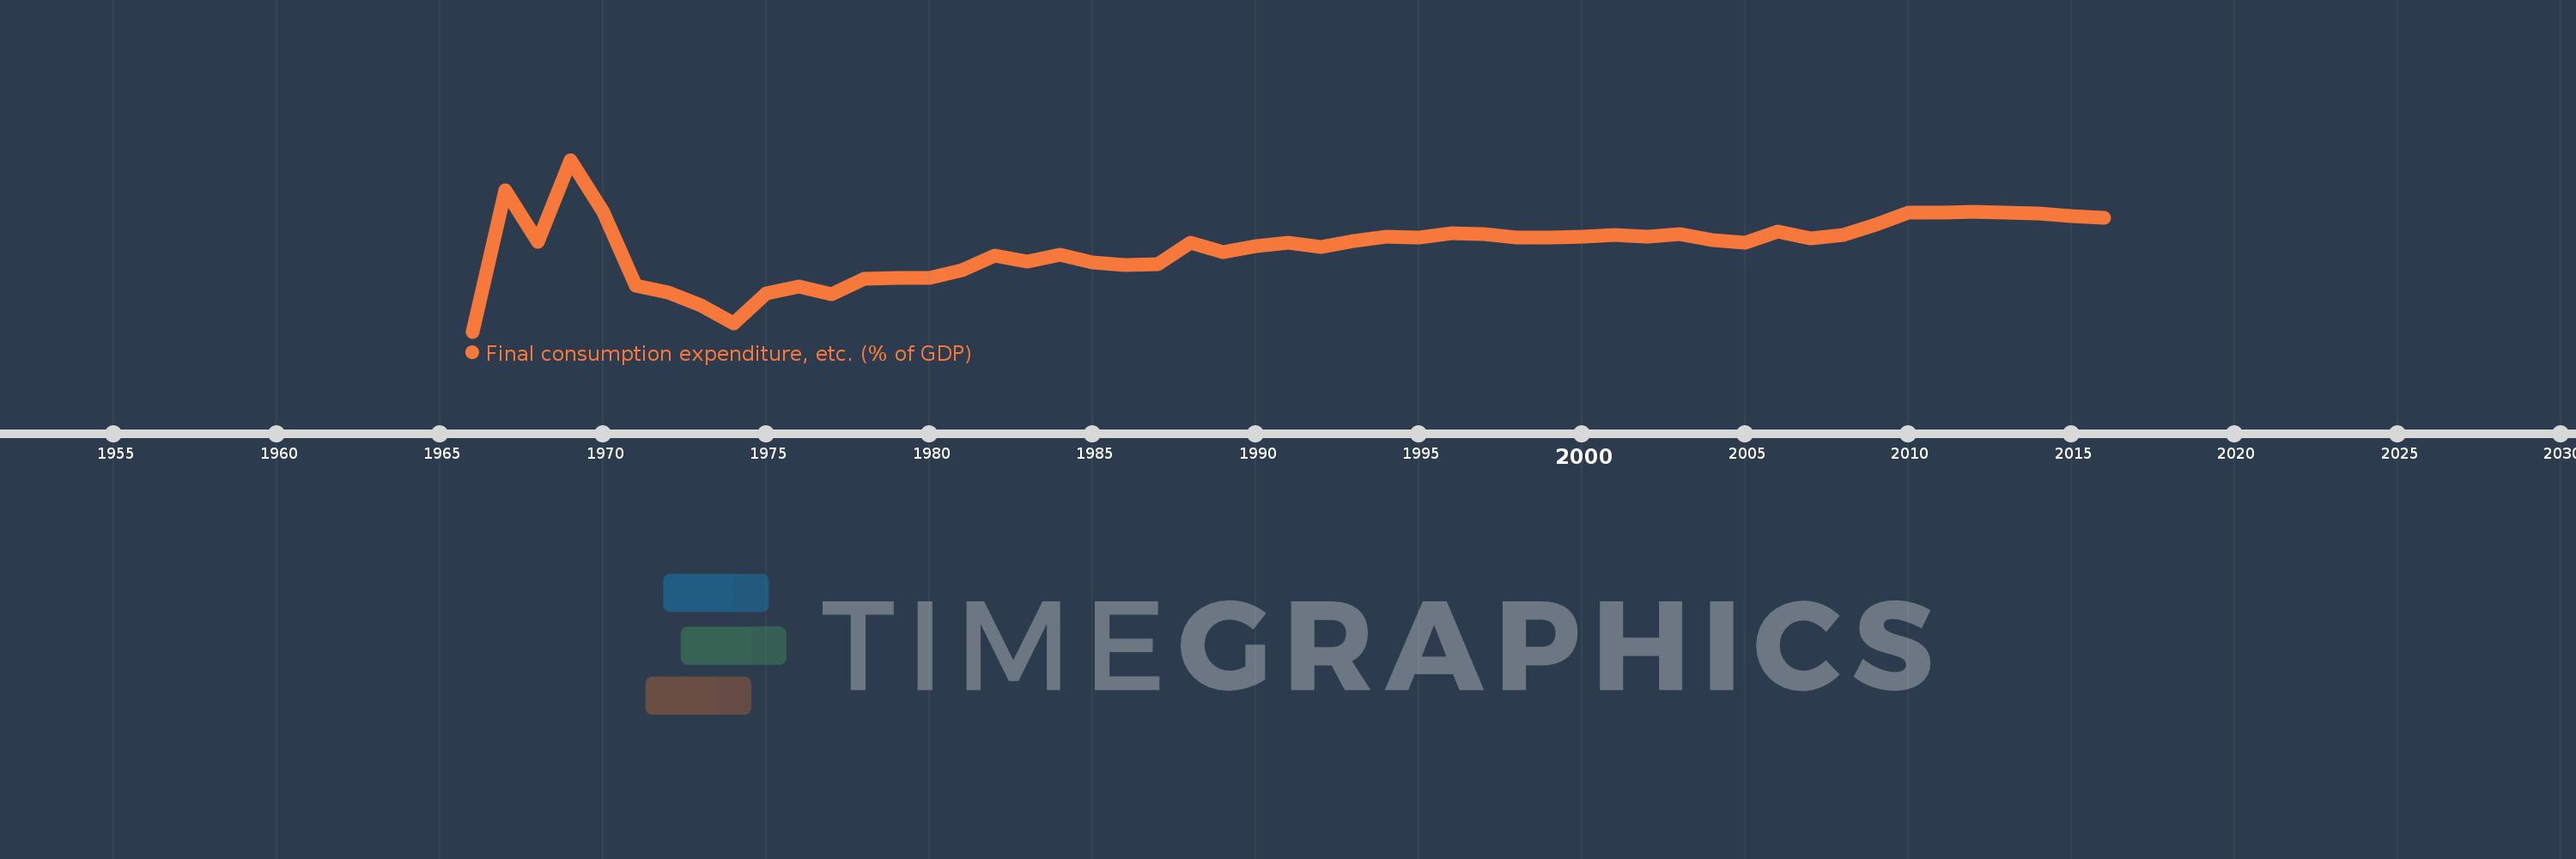
Final consumption expenditure, etc. (% of GDP)
2016,2015,2014,2013,2012,2011,2010,2009,2008,2007,2006,2005,2004,2003,2002,2001,2000,1999,1998,1997,1996,1995,1994,1993,1992,1991,1990,1989,1988,1987,1986,1985,1984,1983,1982,1981,1980,1979,1978,1977,1976,1975,1974,1973,1972,1971,1970,1969,1968,1967,1966
This statistics in other country:
AfghanistanAlbaniaAlgeriaAngolaAntigua and BarbudaArgentinaArmeniaArubaAustraliaAustriaAzerbaijanBahamas, TheBahrainBangladeshBarbadosBelarusBelgiumBelizeBeninBermudaBhutanBoliviaBosnia and HerzegovinaBotswanaBrazilBrunei DarussalamBulgariaBurkina FasoBurundiCabo VerdeCambodiaCameroonCanadaCentral African RepublicChadChileChinaColombiaComorosCongo, Dem. Rep.Congo, Rep.Costa RicaCote d'IvoireCroatiaCubaCyprusCzech RepublicDenmarkDjiboutiDominicaDominican RepublicEcuadorEgypt, Arab Rep.El SalvadorEquatorial GuineaEritreaEstoniaEthiopiaFaroe IslandsFijiFinlandFranceGabonGambia, TheGeorgiaGermanyGhanaGreeceGrenadaGuatemalaGuineaGuinea-BissauGuyanaHaitiHondurasHong Kong SAR, ChinaHungaryIcelandIndiaIndonesiaIran, Islamic Rep.IraqIrelandIsraelItalyJamaicaJapanJordanKazakhstanKenyaKiribatiKorea, Rep.KosovoKuwaitKyrgyz RepublicLao PDRLatviaLebanonLesothoLiberiaLibyaLithuaniaLuxembourgMacao SAR, ChinaMacedonia, FYRMadagascarMalawiMalaysiaMaldivesMaliMaltaMauritaniaMauritiusMexicoMicronesia, Fed. Sts.MoldovaMongoliaMontenegroMoroccoMozambiqueNamibiaNepalNetherlandsNew CaledoniaNew ZealandNicaraguaNigerNigeriaNorwayOmanPakistanPanamaPapua New GuineaParaguayPeruPhilippinesPolandPortugalPuerto RicoQatarRomaniaRussian FederationRwandaSaudi ArabiaSenegalSerbiaSeychellesSierra LeoneSingaporeSlovak RepublicSloveniaSolomon IslandsSomaliaSouth AfricaSouth SudanSpainSri LankaSt. Kitts and NevisSt. LuciaSt. Vincent and the GrenadinesSudanSurinameSwazilandSwedenSwitzerlandSyrian Arab RepublicTajikistanTanzaniaThailandTimor-LesteTogoTongaTrinidad and TobagoTunisiaTurkeyTurkmenistanUgandaUkraineUnited Arab EmiratesUnited KingdomUnited StatesUruguayUzbekistanVanuatuVenezuela, RBVietnamWest Bank and GazaYemen, Rep.ZambiaZimbabwe Timeline:
This timeline shows a graph from 1966 to 2016 of Greece. No data until 1965. Number of actual observations by date: 51.
Source name:
World Development Indicators
Source organization:
World Bank national accounts data, and OECD National Accounts data files.
Categories, topics:
Economy & Growth
Last updated:
apr 23, 2017
Indicators value changes by year
Maximum:
106.452
jan 1, 1969
At the date of observation
Value
Absolute change
Change from previous value
jan 1, 1966
57.96
+57.96
0.0%
jan 1, 1967
97.926
+39.966
68.95%
jan 1, 1968
83.229
-14.696
-15.01%
jan 1, 1969
106.452
+23.222
27.9%
jan 1, 1970
91.891
-14.561
-13.68%
jan 1, 1971
70.886
-21.005
-22.86%
jan 1, 1972
68.988
-1.899
-2.68%
jan 1, 1973
65.311
-3.677
-5.33%
jan 1, 1974
60.172
-5.139
-7.87%
jan 1, 1975
68.793
+8.621
14.33%
jan 1, 1976
70.622
+1.829
2.66%
jan 1, 1977
68.571
-2.051
-2.9%
jan 1, 1978
72.957
+4.386
6.4%
jan 1, 1979
73.049
+0.092
0.13%
jan 1, 1980
73.092
+0.043
0.06%
jan 1, 1981
75.324
+2.232
3.05%
jan 1, 1982
79.341
+4.017
5.33%
jan 1, 1983
77.646
-1.695
-2.14%
jan 1, 1984
79.58
+1.934
2.49%
jan 1, 1985
77.491
-2.089
-2.62%
jan 1, 1986
76.776
-0.715
-0.92%
jan 1, 1987
76.929
+0.153
0.2%
jan 1, 1988
82.989
+6.06
7.88%
jan 1, 1989
80.392
-2.597
-3.13%
jan 1, 1990
82.034
+1.642
2.04%
jan 1, 1991
83.014
+0.981
1.2%
jan 1, 1992
81.788
-1.226
-1.48%
jan 1, 1993
83.655
+1.867
2.28%
jan 1, 1994
84.748
+1.093
1.31%
jan 1, 1995
84.483
-0.266
-0.31%
jan 1, 1996
85.786
+1.303
1.54%
jan 1, 1997
85.568
-0.217
-0.25%
jan 1, 1998
84.389
-1.18
-1.38%
jan 1, 1999
84.5
+0.111
0.13%
jan 1, 2000
84.716
+0.216
0.26%
jan 1, 2001
85.153
+0.437
0.52%
jan 1, 2002
84.871
-0.282
-0.33%
jan 1, 2003
85.374
+0.502
0.59%
jan 1, 2004
83.726
-1.648
-1.93%
jan 1, 2005
83.175
-0.551
-0.66%
jan 1, 2006
86.177
+3.002
3.61%
jan 1, 2007
84.35
-1.827
-2.12%
jan 1, 2008
85.353
+1.002
1.19%
jan 1, 2009
88.095
+2.743
3.21%
jan 1, 2010
91.442
+3.346
3.8%
jan 1, 2011
91.576
+0.135
0.15%
jan 1, 2012
91.669
+0.093
0.1%
jan 1, 2013
91.647
-0.023
-0.02%
jan 1, 2014
91.211
-0.435
-0.48%
jan 1, 2015
90.608
-0.603
-0.66%
jan 1, 2016
90.027
-0.581
-0.64%
Ranking of countries by current statistics by years


Comments: