29
/
en
AIzaSyAYiBZKx7MnpbEhh9jyipgxe19OcubqV5w
April 1, 2024
267940
Tunisia
TUN
true
2
1
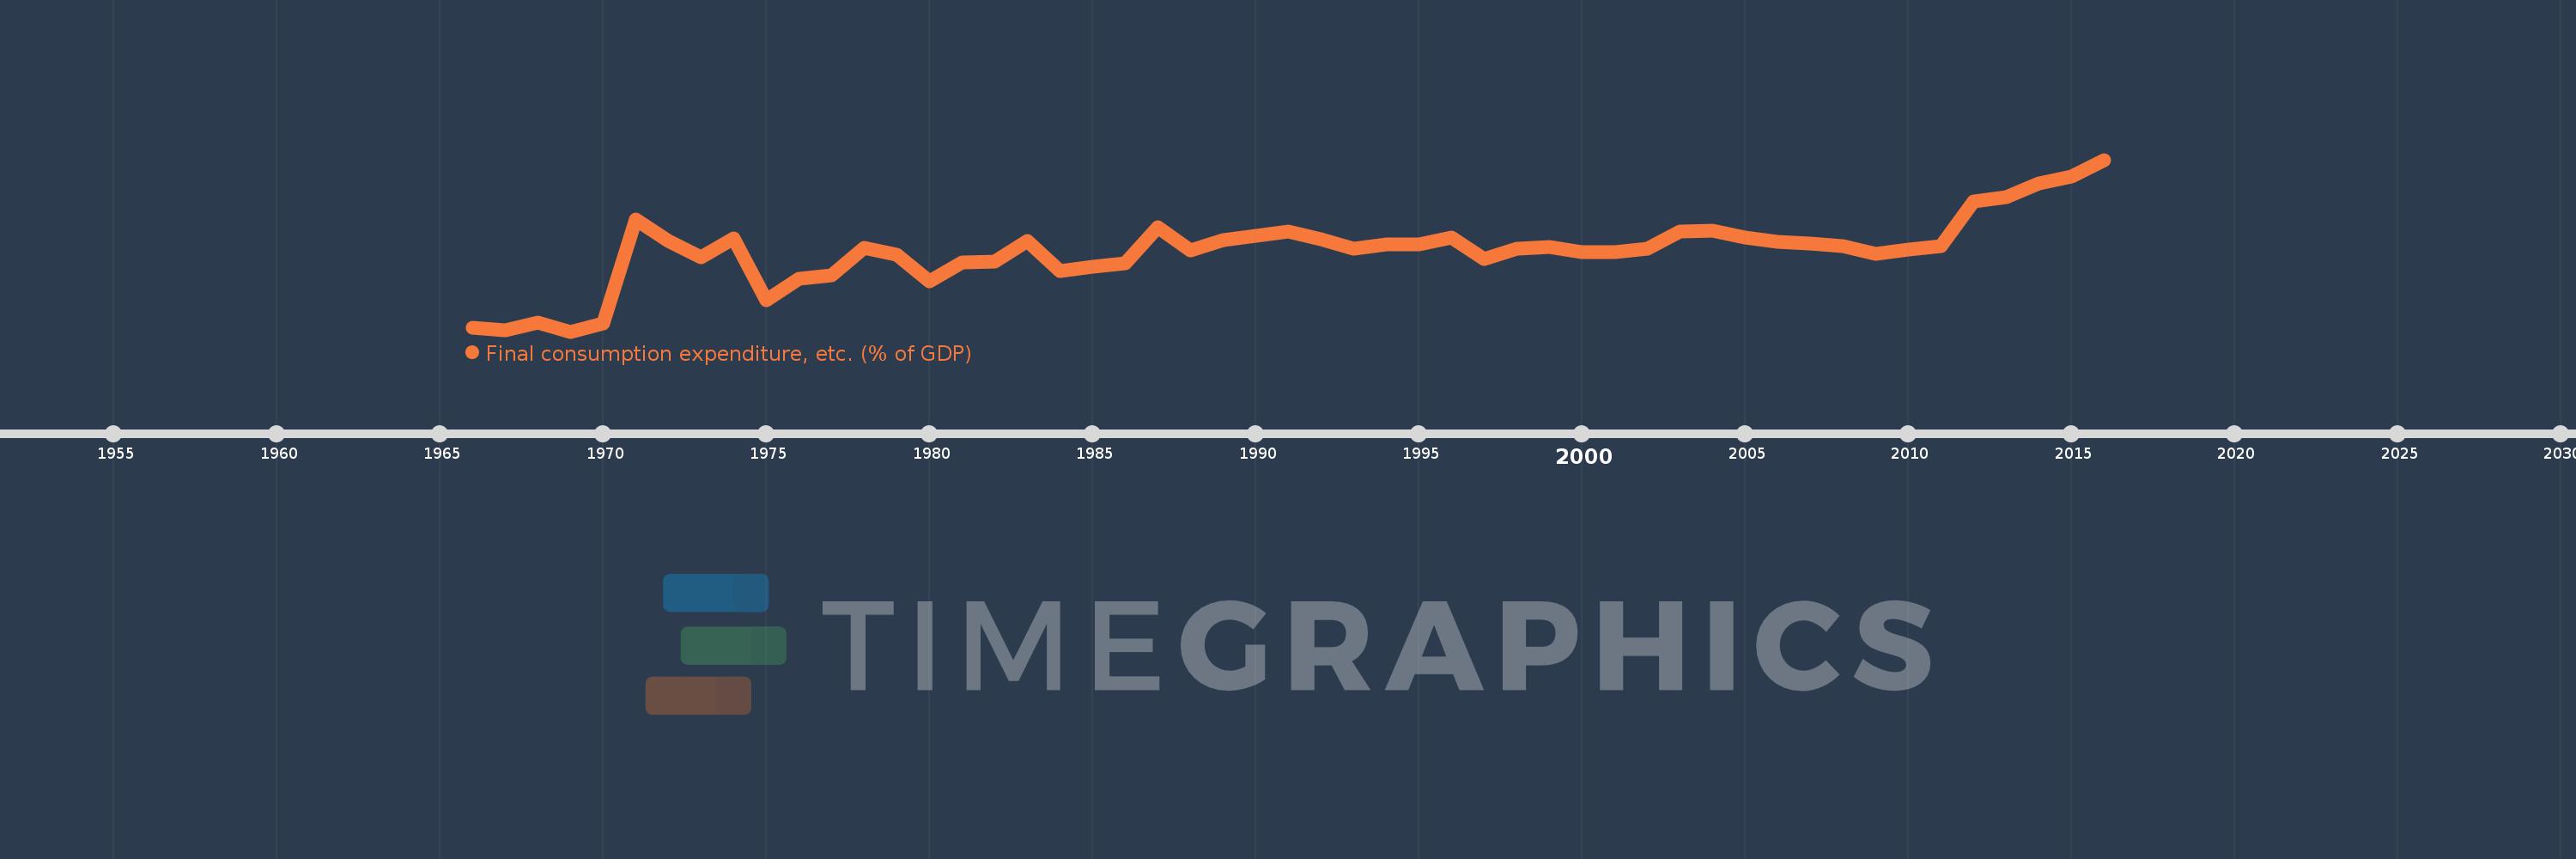
Final consumption expenditure, etc. (% of GDP)
2016,2015,2014,2013,2012,2011,2010,2009,2008,2007,2006,2005,2004,2003,2002,2001,2000,1999,1998,1997,1996,1995,1994,1993,1992,1991,1990,1989,1988,1987,1986,1985,1984,1983,1982,1981,1980,1979,1978,1977,1976,1975,1974,1973,1972,1971,1970,1969,1968,1967,1966
This statistics in other country:
AfghanistanAlbaniaAlgeriaAngolaAntigua and BarbudaArgentinaArmeniaArubaAustraliaAustriaAzerbaijanBahamas, TheBahrainBangladeshBarbadosBelarusBelgiumBelizeBeninBermudaBhutanBoliviaBosnia and HerzegovinaBotswanaBrazilBrunei DarussalamBulgariaBurkina FasoBurundiCabo VerdeCambodiaCameroonCanadaCentral African RepublicChadChileChinaColombiaComorosCongo, Dem. Rep.Congo, Rep.Costa RicaCote d'IvoireCroatiaCubaCyprusCzech RepublicDenmarkDjiboutiDominicaDominican RepublicEcuadorEgypt, Arab Rep.El SalvadorEquatorial GuineaEritreaEstoniaEthiopiaFaroe IslandsFijiFinlandFranceGabonGambia, TheGeorgiaGermanyGhanaGreeceGrenadaGuatemalaGuineaGuinea-BissauGuyanaHaitiHondurasHong Kong SAR, ChinaHungaryIcelandIndiaIndonesiaIran, Islamic Rep.IraqIrelandIsraelItalyJamaicaJapanJordanKazakhstanKenyaKiribatiKorea, Rep.KosovoKuwaitKyrgyz RepublicLao PDRLatviaLebanonLesothoLiberiaLibyaLithuaniaLuxembourgMacao SAR, ChinaMacedonia, FYRMadagascarMalawiMalaysiaMaldivesMaliMaltaMauritaniaMauritiusMexicoMicronesia, Fed. Sts.MoldovaMongoliaMontenegroMoroccoMozambiqueNamibiaNepalNetherlandsNew CaledoniaNew ZealandNicaraguaNigerNigeriaNorwayOmanPakistanPanamaPapua New GuineaParaguayPeruPhilippinesPolandPortugalPuerto RicoQatarRomaniaRussian FederationRwandaSaudi ArabiaSenegalSerbiaSeychellesSierra LeoneSingaporeSlovak RepublicSloveniaSolomon IslandsSomaliaSouth AfricaSouth SudanSpainSri LankaSt. Kitts and NevisSt. LuciaSt. Vincent and the GrenadinesSudanSurinameSwazilandSwedenSwitzerlandSyrian Arab RepublicTajikistanTanzaniaThailandTimor-LesteTogoTongaTrinidad and TobagoTunisiaTurkeyTurkmenistanUgandaUkraineUnited Arab EmiratesUnited KingdomUnited StatesUruguayUzbekistanVanuatuVenezuela, RBVietnamWest Bank and GazaYemen, Rep.ZambiaZimbabwe Timeline:
This timeline shows a graph from 1966 to 2016 of Tunisia. No data until 1965. Number of actual observations by date: 51.
Source name:
World Development Indicators
Source organization:
World Bank national accounts data, and OECD National Accounts data files.
Categories, topics:
Economy & Growth
Last updated:
apr 23, 2017
Indicators value changes by year
Minimum:
66.991
jan 1, 1969
Maximum:
89.345
jan 1, 2016
At the date of observation
Value
Absolute change
Change from previous value
jan 1, 1966
67.442
+67.442
0.0%
jan 1, 1967
67.155
-0.287
-0.43%
jan 1, 1968
68.123
+0.968
1.44%
jan 1, 1969
66.991
-1.132
-1.66%
jan 1, 1970
68.089
+1.098
1.64%
jan 1, 1971
81.604
+13.515
19.85%
jan 1, 1972
78.813
-2.791
-3.42%
jan 1, 1973
76.674
-2.139
-2.71%
jan 1, 1974
79.076
+2.401
3.13%
jan 1, 1975
71.036
-8.04
-10.17%
jan 1, 1976
73.854
+2.818
3.97%
jan 1, 1977
74.273
+0.419
0.57%
jan 1, 1978
77.887
+3.614
4.87%
jan 1, 1979
77.016
-0.871
-1.12%
jan 1, 1980
73.559
-3.457
-4.49%
jan 1, 1981
76.003
+2.444
3.32%
jan 1, 1982
76.139
+0.135
0.18%
jan 1, 1983
78.803
+2.664
3.5%
jan 1, 1984
74.859
-3.943
-5.0%
jan 1, 1985
75.466
+0.607
0.81%
jan 1, 1986
75.867
+0.401
0.53%
jan 1, 1987
80.519
+4.652
6.13%
jan 1, 1988
77.506
-3.014
-3.74%
jan 1, 1989
78.93
+1.424
1.84%
jan 1, 1990
79.404
+0.475
0.6%
jan 1, 1991
79.979
+0.575
0.72%
jan 1, 1992
78.966
-1.013
-1.27%
jan 1, 1993
77.736
-1.231
-1.56%
jan 1, 1994
78.281
+0.545
0.7%
jan 1, 1995
78.296
+0.015
0.02%
jan 1, 1996
79.205
+0.91
1.16%
jan 1, 1997
76.488
-2.717
-3.43%
jan 1, 1998
77.814
+1.326
1.73%
jan 1, 1999
78.023
+0.209
0.27%
jan 1, 2000
77.327
-0.696
-0.89%
jan 1, 2001
77.28
-0.047
-0.06%
jan 1, 2002
77.739
+0.459
0.59%
jan 1, 2003
79.962
+2.223
2.86%
jan 1, 2004
80.1
+0.138
0.17%
jan 1, 2005
79.228
-0.872
-1.09%
jan 1, 2006
78.707
-0.52
-0.66%
jan 1, 2007
78.435
-0.272
-0.35%
jan 1, 2008
78.067
-0.368
-0.47%
jan 1, 2009
77.106
-0.961
-1.23%
jan 1, 2010
77.706
+0.601
0.78%
jan 1, 2011
78.088
+0.382
0.49%
jan 1, 2012
83.875
+5.787
7.41%
jan 1, 2013
84.519
+0.645
0.77%
jan 1, 2014
86.316
+1.796
2.13%
jan 1, 2015
87.188
+0.873
1.01%
jan 1, 2016
89.345
+2.157
2.47%
Ranking of countries by current statistics by years


Comments: